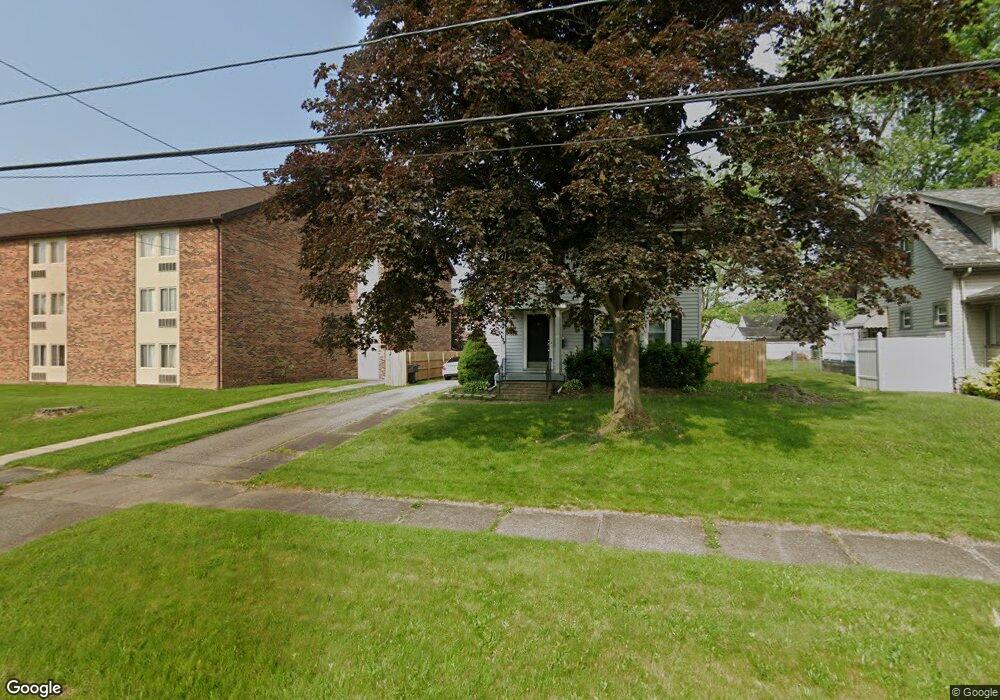
177 Kenmore Ave NE Warren, OH 44483
Harding NeighborhoodEstimated Value: $118,737 - $172,000
3
Beds
2
Baths
1,448
Sq Ft
$94/Sq Ft
Est. Value
About This Home
This home is located at 177 Kenmore Ave NE, Warren, OH 44483 and is currently estimated at $135,934, approximately $93 per square foot. 177 Kenmore Ave NE is a home located in Trumbull County with nearby schools including Lincoln PK-8 School, Warren G. Harding High School, and Steam Academy of Warren.
Ownership History
Date
Name
Owned For
Owner Type
Purchase Details
Closed on
May 19, 2021
Sold by
Cetrone Vincent M
Bought by
Hornak Robin M
Current Estimated Value
Home Financials for this Owner
Home Financials are based on the most recent Mortgage that was taken out on this home.
Original Mortgage
$74,623
Outstanding Balance
$67,627
Interest Rate
3.1%
Mortgage Type
FHA
Estimated Equity
$68,307
Purchase Details
Closed on
Apr 14, 2015
Sold by
Cetrone Consulants Llc
Bought by
Cetrone Vincent M
Home Financials for this Owner
Home Financials are based on the most recent Mortgage that was taken out on this home.
Original Mortgage
$73,641
Interest Rate
4.37%
Mortgage Type
FHA
Purchase Details
Closed on
Feb 11, 2008
Sold by
Haynie Kevin R and Haynie Abbie L
Bought by
Cetrone Consultants Llc
Purchase Details
Closed on
Aug 3, 2001
Sold by
Hickox Elmer J
Bought by
Haynie Kevin R
Purchase Details
Closed on
Jan 1, 1990
Bought by
Elmer Jay Hickox
Create a Home Valuation Report for This Property
The Home Valuation Report is an in-depth analysis detailing your home's value as well as a comparison with similar homes in the area
Home Values in the Area
Average Home Value in this Area
Purchase History
| Date | Buyer | Sale Price | Title Company |
|---|---|---|---|
| Hornak Robin M | $76,000 | Servicelink | |
| Cetrone Vincent M | $75,000 | Attorney | |
| Cetrone Consultants Llc | $83,000 | Attorney | |
| Haynie Kevin R | $68,500 | -- | |
| Elmer Jay Hickox | -- | -- |
Source: Public Records
Mortgage History
| Date | Status | Borrower | Loan Amount |
|---|---|---|---|
| Open | Hornak Robin M | $74,623 | |
| Previous Owner | Cetrone Vincent M | $73,641 | |
| Closed | Haynie Kevin R | -- |
Source: Public Records
Tax History Compared to Growth
Tax History
| Year | Tax Paid | Tax Assessment Tax Assessment Total Assessment is a certain percentage of the fair market value that is determined by local assessors to be the total taxable value of land and additions on the property. | Land | Improvement |
|---|---|---|---|---|
| 2024 | $1,577 | $31,150 | $4,340 | $26,810 |
| 2023 | $1,577 | $31,150 | $4,340 | $26,810 |
| 2022 | $1,638 | $25,270 | $4,340 | $20,930 |
| 2021 | $1,641 | $25,270 | $4,340 | $20,930 |
| 2020 | $1,643 | $25,270 | $4,340 | $20,930 |
| 2019 | $1,577 | $23,030 | $4,340 | $18,690 |
| 2018 | $1,571 | $23,030 | $4,340 | $18,690 |
| 2017 | $1,547 | $23,030 | $4,340 | $18,690 |
| 2016 | $1,445 | $22,270 | $5,080 | $17,190 |
| 2015 | $1,435 | $22,270 | $5,080 | $17,190 |
| 2014 | -- | $22,270 | $5,080 | $17,190 |
| 2013 | $1,458 | $23,980 | $5,080 | $18,900 |
Source: Public Records
Map
Nearby Homes
- 213 Kenmore Ave NE
- 2816 E Market St
- 564 Adelaide Ave NE
- 244 Adelaide Ave SE
- 591 Belvedere Ave NE
- 327 Adelaide Ave SE
- 159 Kenilworth Ave SE
- 424 Kenilworth Ave NE
- 427 Butler Rd NE
- 703 Melwood Dr NE
- 735 Adelaide Ave NE
- 249 Central Parkway Ave SE
- 210 Fairmount Ave NE
- 517 Oak Knoll Ave SE
- 548 Adelaide Ave SE
- 553 Willard Ave SE
- 156 Bonnie Brae Ave NE
- 151 Bonnie Brae Ave NE
- 641 Fairway Dr NE
- 3138 Overlook Dr NE
- 191 Kenmore Ave NE
- 203 Kenmore Ave NE
- 194 Belvedere Ave NE
- 168 Kenmore Ave NE
- 206 Belvedere Ave NE
- 178 Kenmore Ave NE
- 168 Kenmore Ave NE
- 190 Kenmore Ave NE
- 223 Kenmore Ave NE
- 156 Kenmore Ave NE
- 216 Belvedere Ave NE
- 198 Kenmore Ave NE
- 180 Belvedere Ave NE
- 146 Kenmore Ave NE
- 233 Kenmore Ave NE
- 228 Belvedere Ave NE
- 222 Kenmore Ave NE
- 2155 E Market St
- 243 Kenmore Ave NE
- 2219 E Market St