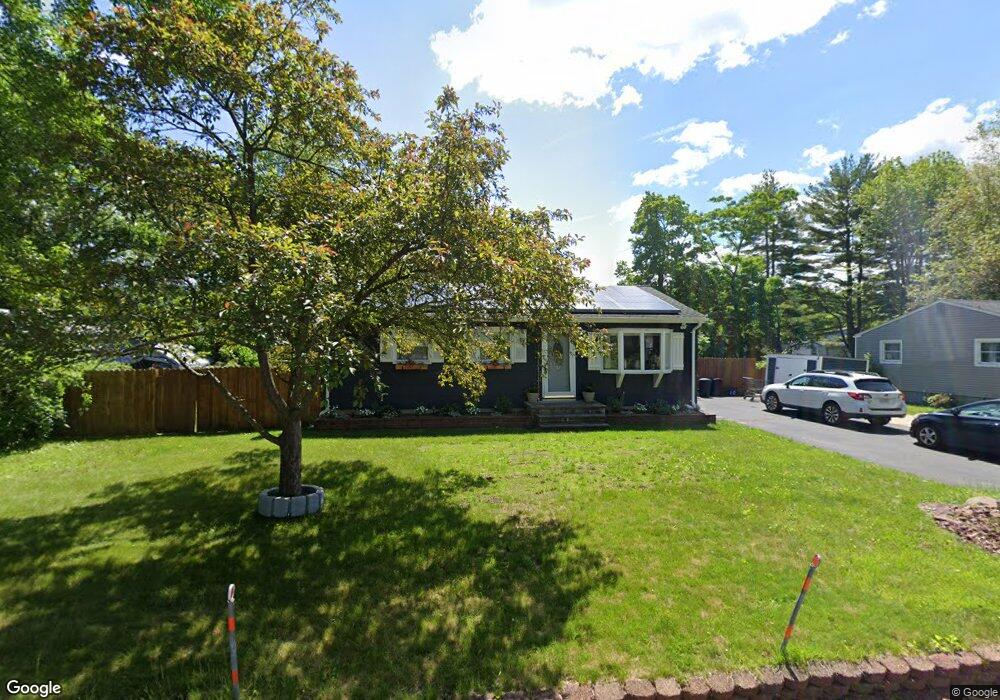
177 Kerry Dr Springfield, MA 01118
Sixteen Acres NeighborhoodEstimated Value: $290,703 - $305,000
3
Beds
2
Baths
999
Sq Ft
$297/Sq Ft
Est. Value
About This Home
This home is located at 177 Kerry Dr, Springfield, MA 01118 and is currently estimated at $296,926, approximately $297 per square foot. 177 Kerry Dr is a home located in Hampden County with nearby schools including Arthur T Talmadge Elementary School, M Marcus Kiley Middle, and Springfield High School of Science and Technology.
Ownership History
Date
Name
Owned For
Owner Type
Purchase Details
Closed on
Feb 26, 1999
Sold by
Soucie Andrew M and Soucie Evelyn A
Bought by
Spaulding Robert N and Spaulding Julie A
Current Estimated Value
Home Financials for this Owner
Home Financials are based on the most recent Mortgage that was taken out on this home.
Original Mortgage
$86,700
Outstanding Balance
$21,037
Interest Rate
6.78%
Mortgage Type
Purchase Money Mortgage
Estimated Equity
$275,889
Purchase Details
Closed on
Aug 12, 1988
Sold by
Luppi Edward V
Bought by
Soucie Andrew M
Home Financials for this Owner
Home Financials are based on the most recent Mortgage that was taken out on this home.
Original Mortgage
$84,000
Interest Rate
10.34%
Mortgage Type
Purchase Money Mortgage
Create a Home Valuation Report for This Property
The Home Valuation Report is an in-depth analysis detailing your home's value as well as a comparison with similar homes in the area
Home Values in the Area
Average Home Value in this Area
Purchase History
| Date | Buyer | Sale Price | Title Company |
|---|---|---|---|
| Spaulding Robert N | $85,000 | -- | |
| Soucie Andrew M | $112,000 | -- |
Source: Public Records
Mortgage History
| Date | Status | Borrower | Loan Amount |
|---|---|---|---|
| Open | Soucie Andrew M | $10,000 | |
| Open | Soucie Andrew M | $86,700 | |
| Previous Owner | Soucie Andrew M | $80,800 | |
| Previous Owner | Soucie Andrew M | $84,000 |
Source: Public Records
Tax History Compared to Growth
Tax History
| Year | Tax Paid | Tax Assessment Tax Assessment Total Assessment is a certain percentage of the fair market value that is determined by local assessors to be the total taxable value of land and additions on the property. | Land | Improvement |
|---|---|---|---|---|
| 2025 | $3,697 | $235,800 | $58,200 | $177,600 |
| 2024 | $3,594 | $223,800 | $58,200 | $165,600 |
| 2023 | $3,297 | $193,400 | $55,400 | $138,000 |
| 2022 | $3,410 | $181,200 | $55,400 | $125,800 |
| 2021 | $2,843 | $150,400 | $50,300 | $100,100 |
| 2020 | $2,908 | $148,900 | $50,300 | $98,600 |
| 2019 | $2,724 | $138,400 | $50,300 | $88,100 |
| 2018 | $2,720 | $138,200 | $50,300 | $87,900 |
| 2017 | $2,640 | $134,300 | $50,300 | $84,000 |
| 2016 | $2,522 | $128,300 | $50,300 | $78,000 |
| 2015 | $2,455 | $124,800 | $50,300 | $74,500 |
Source: Public Records
Map
Nearby Homes
- 331 Newhouse St
- 41 Kerry Dr
- 41 Hillside Dr
- 82 Louis Rd
- 399 Elm St
- 15 Lynwood Rd
- 86 Talmadge Dr
- 17 Pebble Mill Rd
- 19 Westminster St
- 206 Treetop Ave
- 54 Shady Brook Ln
- 43 Sunridge Dr
- 99 W Crystal Brook Dr
- 55 Allen St
- 125 Manor Ct Unit 125
- 32 Lindsay Rd
- 19 Manor Ct Unit 19
- 5 Manor Ct Unit 5
- 157 Canterbury Rd
- 56 Hadley St