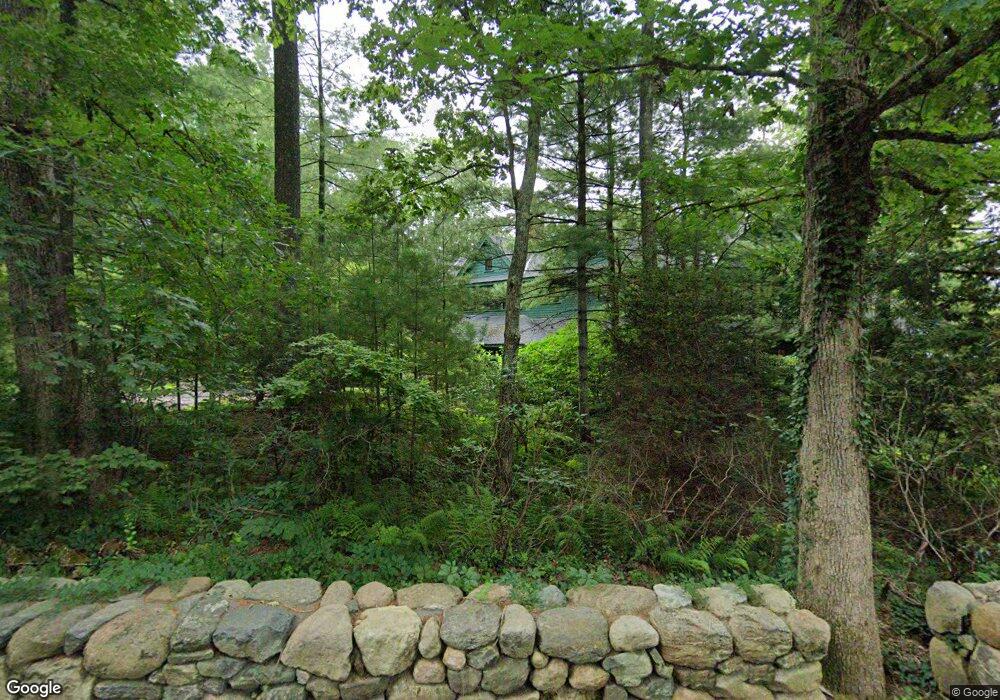
177 Lake St Sherborn, MA 01770
Estimated Value: $2,421,000 - $3,576,000
4
Beds
8
Baths
8,265
Sq Ft
$378/Sq Ft
Est. Value
About This Home
This home is located at 177 Lake St, Sherborn, MA 01770 and is currently estimated at $3,125,772, approximately $378 per square foot. 177 Lake St is a home located in Middlesex County with nearby schools including Pine Hill Elementary School, Dover-Sherborn Regional Middle School, and Dover-Sherborn Regional High School.
Ownership History
Date
Name
Owned For
Owner Type
Purchase Details
Closed on
Apr 4, 2013
Sold by
Murchison Robert W and Murchison Alison H
Bought by
Lnd E Grew Parker Fam
Current Estimated Value
Purchase Details
Closed on
Oct 4, 2006
Sold by
Fiduciary Trust Co
Bought by
Murchison Alison H and Murchison Robert W
Create a Home Valuation Report for This Property
The Home Valuation Report is an in-depth analysis detailing your home's value as well as a comparison with similar homes in the area
Home Values in the Area
Average Home Value in this Area
Purchase History
| Date | Buyer | Sale Price | Title Company |
|---|---|---|---|
| Lnd E Grew Parker Fam | -- | -- | |
| Murchison Alison H | $2,434,000 | -- |
Source: Public Records
Tax History Compared to Growth
Tax History
| Year | Tax Paid | Tax Assessment Tax Assessment Total Assessment is a certain percentage of the fair market value that is determined by local assessors to be the total taxable value of land and additions on the property. | Land | Improvement |
|---|---|---|---|---|
| 2025 | $47,606 | $2,871,300 | $1,409,300 | $1,462,000 |
| 2024 | $69,139 | $4,079,000 | $1,409,300 | $2,669,700 |
| 2023 | $71,575 | $3,974,200 | $1,409,300 | $2,564,900 |
| 2022 | $71,579 | $3,761,400 | $1,334,500 | $2,426,900 |
| 2021 | $4,206 | $3,761,400 | $1,334,500 | $2,426,900 |
| 2020 | $73,197 | $3,761,400 | $1,334,500 | $2,426,900 |
| 2019 | $75,719 | $3,859,300 | $1,546,100 | $2,313,200 |
| 2018 | $5,009 | $3,975,700 | $1,662,500 | $2,313,200 |
| 2017 | $79,761 | $3,898,400 | $1,662,500 | $2,235,900 |
| 2016 | $80,190 | $3,898,400 | $1,662,500 | $2,235,900 |
| 2015 | $79,423 | $3,908,600 | $1,662,500 | $2,246,100 |
| 2014 | $78,935 | $3,880,800 | $1,662,500 | $2,218,300 |
Source: Public Records
Map
Nearby Homes
- 65 Farm Road Lot 6
- 14 Sewall Brook Ln
- 2 Surrey Ln
- 32 Lake St
- 53 Yorkshire Rd
- 4 Green Ln
- 114 Farm St
- 15 Wyndemere Ln
- 25 Yorkshire Rd
- 8 Greystone Rd
- 39 Indian Ridge Rd
- 220 S Main St
- 105 N Main St
- 67 Farm St
- 61 Old Orchard Rd
- 16 Wayside Rd Unit 14
- 16 Wayside Rd
- 48 Graystone Ln
- 2 Partridge Hill Rd
- 21 Harvest Moon Dr