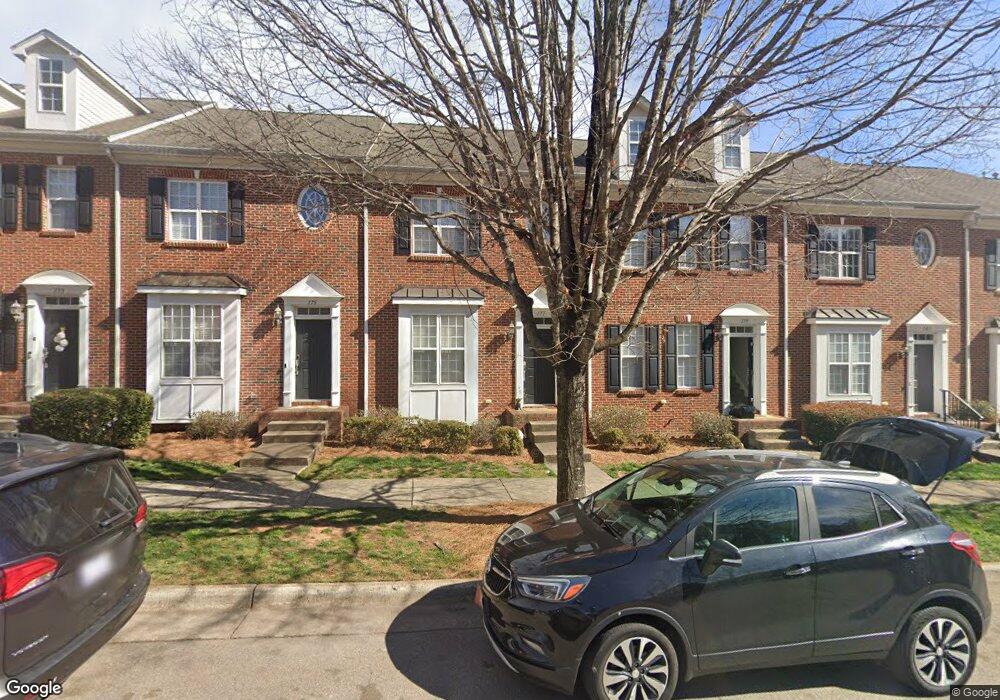
177 Lumina Place Holly Springs, NC 27540
Estimated Value: $332,000 - $374,000
2
Beds
3
Baths
1,637
Sq Ft
$220/Sq Ft
Est. Value
About This Home
This home is located at 177 Lumina Place, Holly Springs, NC 27540 and is currently estimated at $359,678, approximately $219 per square foot. 177 Lumina Place is a home located in Wake County with nearby schools including Holly Springs Elementary School, Holly Ridge Middle School, and Holly Springs High School.
Ownership History
Date
Name
Owned For
Owner Type
Purchase Details
Closed on
Nov 5, 2021
Sold by
Javidi Properties Llc
Bought by
Bohr Jeffrey Clifton
Current Estimated Value
Purchase Details
Closed on
Jan 2, 2016
Sold by
Wood John P and Wood Michelle R
Bought by
Javidi Properties Llc
Purchase Details
Closed on
Dec 29, 2004
Sold by
Ketchabaw David J and Ketchabaw Melissa
Bought by
Wood John P
Home Financials for this Owner
Home Financials are based on the most recent Mortgage that was taken out on this home.
Original Mortgage
$126,400
Interest Rate
5.75%
Mortgage Type
Fannie Mae Freddie Mac
Purchase Details
Closed on
Oct 29, 2002
Sold by
Mcneill Burbank Homes Llc
Bought by
Ketchabaw David J and Juris Melissa S
Home Financials for this Owner
Home Financials are based on the most recent Mortgage that was taken out on this home.
Original Mortgage
$111,992
Interest Rate
5%
Create a Home Valuation Report for This Property
The Home Valuation Report is an in-depth analysis detailing your home's value as well as a comparison with similar homes in the area
Home Values in the Area
Average Home Value in this Area
Purchase History
| Date | Buyer | Sale Price | Title Company |
|---|---|---|---|
| Bohr Jeffrey Clifton | $315,500 | None Available | |
| Javidi Properties Llc | $180,000 | None Available | |
| Wood John P | $158,000 | -- | |
| Ketchabaw David J | $140,000 | -- |
Source: Public Records
Mortgage History
| Date | Status | Borrower | Loan Amount |
|---|---|---|---|
| Previous Owner | Wood John P | $126,400 | |
| Previous Owner | Ketchabaw David J | $111,992 | |
| Closed | Ketchabaw David J | $20,998 |
Source: Public Records
Tax History Compared to Growth
Tax History
| Year | Tax Paid | Tax Assessment Tax Assessment Total Assessment is a certain percentage of the fair market value that is determined by local assessors to be the total taxable value of land and additions on the property. | Land | Improvement |
|---|---|---|---|---|
| 2025 | -- | $345,730 | $90,000 | $255,730 |
| 2024 | $2,983 | $345,730 | $90,000 | $255,730 |
| 2023 | $2,203 | $202,388 | $52,000 | $150,388 |
| 2022 | $2,127 | $202,388 | $52,000 | $150,388 |
| 2021 | $2,088 | $202,388 | $52,000 | $150,388 |
| 2020 | $2,088 | $202,388 | $52,000 | $150,388 |
| 2019 | $2,006 | $165,062 | $31,200 | $133,862 |
| 2018 | $1,814 | $165,062 | $31,200 | $133,862 |
| 2017 | $1,749 | $165,062 | $31,200 | $133,862 |
| 2016 | $1,725 | $165,062 | $31,200 | $133,862 |
| 2015 | $1,754 | $165,213 | $42,000 | $123,213 |
| 2014 | $1,694 | $165,213 | $42,000 | $123,213 |
Source: Public Records
Map
Nearby Homes
- 305 Savannah Ridge Rd
- 215 Savannah Ridge Rd Unit 215
- 104 Crossway Ln
- 204 Crossway Ln
- 4809 Greenpoint Ln
- 129 Starwood Ln
- 0/416 Holly Springs Rd
- 4924 Gable Ridge Ln
- 5120 Linksland Dr
- 108 Warm Wood Ln
- 201 Seagraves Creek Ln
- 204 Seagraves Creek Ln
- 113 Seagraves Creek Ln
- 132 Seagraves Creek Ln
- 200 Seagraves Creek Ln
- 124 Seagraves Creek Ln
- 120 Seagraves Creek Ln
- 100 Castien Cove Place
- 155 Writing Rock Place
- 157 Writing Rock Place
- 177 Lumina Place
- 177 Lumina Place
- 177 Lumina Place
- 175 Lumina Place
- 179 Lumina Place
- 181 Lumina Place
- 173 Lumina Place
- 183 Lumina Place
- 171 Lumina Place
- 185 Lumina Place
- 169 Lumina Place Unit 50
- 187 Lumina Place
- 165 Lumina Place Unit 49
- 164 Lumina Place
- 166 Lumina Place
- 168 Lumina Place
- 160 Lumina Place
- 161 Lumina Place Unit 48
- 170 Lumina Place
- 172 Lumina Place