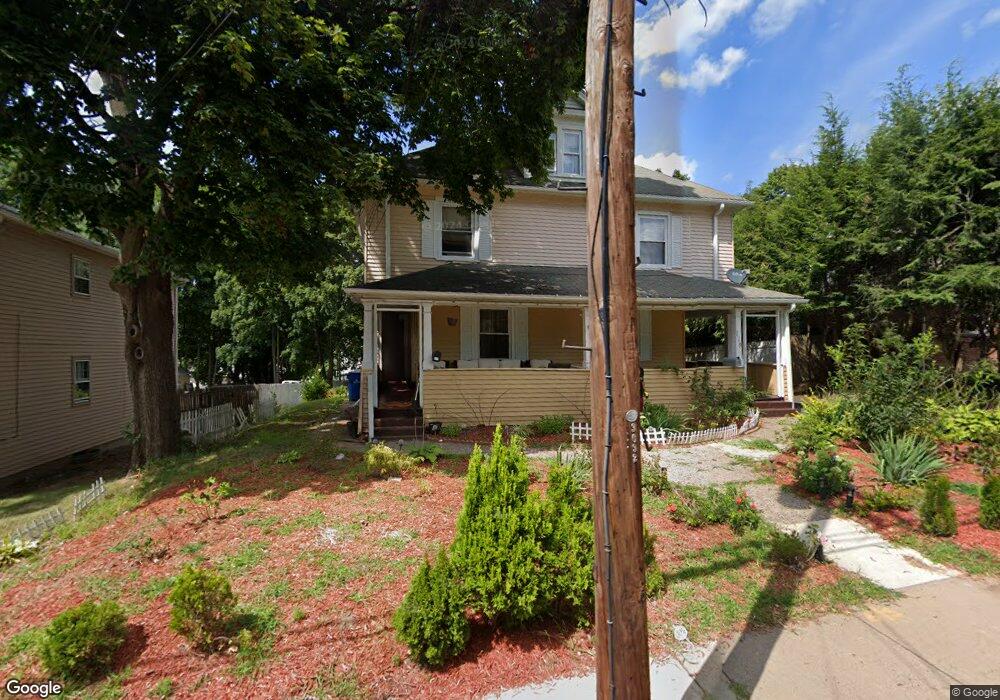
177 Maple St Manchester, CT 06040
East Side NeighborhoodEstimated Value: $323,000 - $496,000
7
Beds
3
Baths
3,648
Sq Ft
$112/Sq Ft
Est. Value
About This Home
This home is located at 177 Maple St, Manchester, CT 06040 and is currently estimated at $407,767, approximately $111 per square foot. 177 Maple St is a home located in Hartford County with nearby schools including Martin Elementary School, Elisabeth M. Bennet Academy, and Illing Middle School.
Ownership History
Date
Name
Owned For
Owner Type
Purchase Details
Closed on
Apr 1, 2011
Sold by
Martinez Nelson
Bought by
Marshall Swezze K
Current Estimated Value
Home Financials for this Owner
Home Financials are based on the most recent Mortgage that was taken out on this home.
Original Mortgage
$146,294
Outstanding Balance
$100,693
Interest Rate
4.75%
Mortgage Type
FHA
Estimated Equity
$307,074
Purchase Details
Closed on
Jan 2, 2003
Sold by
Barlow Tr Malcolm F
Bought by
Martinez Nelson
Home Financials for this Owner
Home Financials are based on the most recent Mortgage that was taken out on this home.
Original Mortgage
$179,188
Interest Rate
6.08%
Create a Home Valuation Report for This Property
The Home Valuation Report is an in-depth analysis detailing your home's value as well as a comparison with similar homes in the area
Home Values in the Area
Average Home Value in this Area
Purchase History
| Date | Buyer | Sale Price | Title Company |
|---|---|---|---|
| Marshall Swezze K | $150,000 | -- | |
| Marshall Swezze K | $150,000 | -- | |
| Martinez Nelson | $182,000 | -- | |
| Martinez Nelson | $182,000 | -- |
Source: Public Records
Mortgage History
| Date | Status | Borrower | Loan Amount |
|---|---|---|---|
| Open | Martinez Nelson | $146,294 | |
| Closed | Martinez Nelson | $146,294 | |
| Previous Owner | Martinez Nelson | $179,188 |
Source: Public Records
Tax History
| Year | Tax Paid | Tax Assessment Tax Assessment Total Assessment is a certain percentage of the fair market value that is determined by local assessors to be the total taxable value of land and additions on the property. | Land | Improvement |
|---|---|---|---|---|
| 2025 | $7,331 | $184,100 | $30,900 | $153,200 |
| 2024 | $7,121 | $184,100 | $30,900 | $153,200 |
| 2023 | $6,849 | $184,100 | $30,900 | $153,200 |
| 2022 | $6,650 | $184,100 | $30,900 | $153,200 |
| 2021 | $5,891 | $140,500 | $28,200 | $112,300 |
| 2020 | $5,883 | $140,500 | $28,200 | $112,300 |
| 2019 | $5,859 | $140,500 | $28,200 | $112,300 |
| 2018 | $5,748 | $140,500 | $28,200 | $112,300 |
| 2017 | $5,585 | $140,500 | $28,200 | $112,300 |
| 2016 | $5,440 | $137,100 | $35,900 | $101,200 |
| 2015 | $5,402 | $137,100 | $35,900 | $101,200 |
| 2014 | $5,299 | $137,100 | $35,900 | $101,200 |
Source: Public Records
Map
Nearby Homes
- 111 Eldridge St
- 67 Bissell St
- 49 Birch St
- 25 Forest St Unit B
- 215 Spring St
- 190 Chestnut St
- 28 Elwood Rd
- 52 Gerard St
- 150 Summit St
- 202 S Main St
- 3 Anderson St
- 143 Boulder Rd
- 20 Prospect St Unit 64
- 26 Prospect St Unit 19
- 68 Cooper Hill St
- 290 Gardner St
- 300 Gardner St
- 342 Center St
- 66 Haystack Rd
- 4 Buckingham St
Your Personal Tour Guide
Ask me questions while you tour the home.