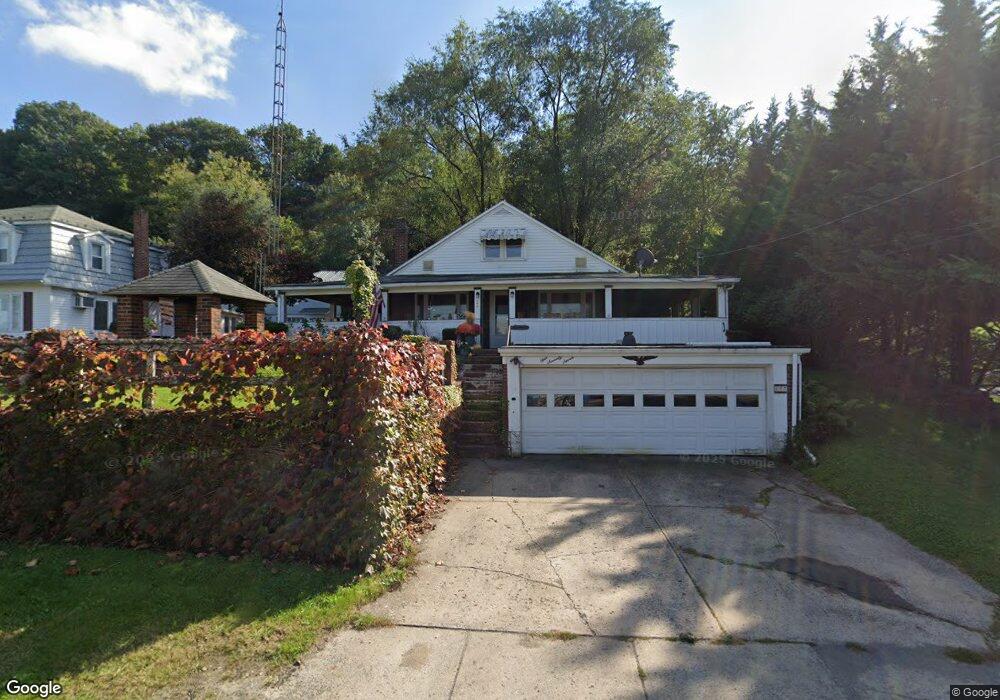
177 Maple St Mifflinburg, PA 17844
Estimated Value: $257,000 - $276,000
3
Beds
2
Baths
1,632
Sq Ft
$163/Sq Ft
Est. Value
About This Home
This home is located at 177 Maple St, Mifflinburg, PA 17844 and is currently estimated at $266,166, approximately $163 per square foot. 177 Maple St is a home located in Union County with nearby schools including Mifflinburg Elementary School, Mifflinburg Area Intermediate School, and Mifflinburg Area Middle School.
Ownership History
Date
Name
Owned For
Owner Type
Purchase Details
Closed on
Apr 26, 2011
Sold by
L & R Investment and Lauver Robert
Bought by
Reichenbach Nicholas A and Reichenbach Amy N
Current Estimated Value
Home Financials for this Owner
Home Financials are based on the most recent Mortgage that was taken out on this home.
Original Mortgage
$94,570
Outstanding Balance
$65,327
Interest Rate
4.75%
Mortgage Type
FHA
Estimated Equity
$200,839
Purchase Details
Closed on
Feb 17, 2010
Sold by
Fannie Mae
Bought by
L & R Investments
Home Financials for this Owner
Home Financials are based on the most recent Mortgage that was taken out on this home.
Original Mortgage
$67,000
Interest Rate
5.17%
Mortgage Type
FHA
Purchase Details
Closed on
Nov 24, 2009
Sold by
Bac Home Loans Servicing Lp
Bought by
Fannie Mae
Purchase Details
Closed on
Oct 2, 2009
Sold by
Weiss Crisma C and Kirkner Melissa M
Bought by
Bac Home Loans Lp and Countyrwide Home Loans Servicing Lp
Create a Home Valuation Report for This Property
The Home Valuation Report is an in-depth analysis detailing your home's value as well as a comparison with similar homes in the area
Home Values in the Area
Average Home Value in this Area
Purchase History
| Date | Buyer | Sale Price | Title Company |
|---|---|---|---|
| Reichenbach Nicholas A | $98,000 | None Available | |
| L & R Investments | $57,000 | None Available | |
| Fannie Mae | -- | None Available | |
| Bac Home Loans Lp | $5,529 | None Available |
Source: Public Records
Mortgage History
| Date | Status | Borrower | Loan Amount |
|---|---|---|---|
| Open | Reichenbach Nicholas A | $94,570 | |
| Previous Owner | L & R Investments | $67,000 |
Source: Public Records
Tax History Compared to Growth
Tax History
| Year | Tax Paid | Tax Assessment Tax Assessment Total Assessment is a certain percentage of the fair market value that is determined by local assessors to be the total taxable value of land and additions on the property. | Land | Improvement |
|---|---|---|---|---|
| 2025 | $2,514 | $127,000 | $23,200 | $103,800 |
| 2024 | $2,514 | $127,000 | $23,200 | $103,800 |
| 2023 | $2,432 | $127,000 | $23,200 | $103,800 |
| 2022 | $2,421 | $127,000 | $23,200 | $103,800 |
| 2021 | $2,397 | $127,000 | $23,200 | $103,800 |
| 2020 | $2,342 | $127,000 | $23,200 | $103,800 |
| 2019 | $2,295 | $127,000 | $23,200 | $103,800 |
| 2018 | $2,248 | $127,000 | $23,200 | $103,800 |
| 2017 | $2,198 | $127,000 | $23,200 | $103,800 |
| 2016 | $2,085 | $127,000 | $23,200 | $103,800 |
| 2015 | -- | $127,000 | $23,200 | $103,800 |
| 2014 | -- | $127,000 | $23,200 | $103,800 |
Source: Public Records
Map
Nearby Homes