Estimated Value: $451,398 - $602,000
3
Beds
2
Baths
1,569
Sq Ft
$353/Sq Ft
Est. Value
About This Home
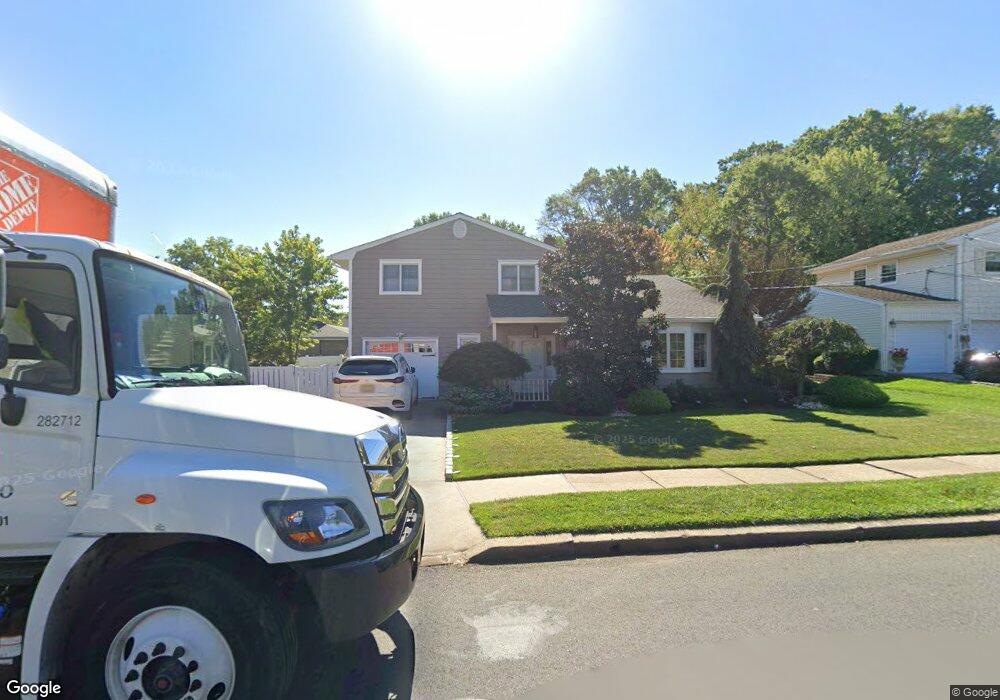
This home is located at 177 Marlin Dr, Fords, NJ 08863 and is currently estimated at $553,850, approximately $352 per square foot. 177 Marlin Dr is a home located in Middlesex County with nearby schools including Ford Avenue Elementary School, Fords Middle School, and Woodbridge High School.
Ownership History
Date
Name
Owned For
Owner Type
Purchase Details
Closed on
Dec 17, 2018
Sold by
Joraskie Joseph and Joraskie Robyn
Bought by
Rodriguez Andrei and Walczak Nicole
Current Estimated Value
Home Financials for this Owner
Home Financials are based on the most recent Mortgage that was taken out on this home.
Original Mortgage
$365,760
Outstanding Balance
$322,242
Interest Rate
4.8%
Mortgage Type
New Conventional
Estimated Equity
$231,608
Purchase Details
Closed on
Aug 29, 1988
Bought by
Joraskie Joseph and Joraskie Robyn
Create a Home Valuation Report for This Property
The Home Valuation Report is an in-depth analysis detailing your home's value as well as a comparison with similar homes in the area
Home Values in the Area
Average Home Value in this Area
Purchase History
| Date | Buyer | Sale Price | Title Company |
|---|---|---|---|
| Rodriguez Andrei | $385,000 | None Available | |
| Joraskie Joseph | $170,000 | -- |
Source: Public Records
Mortgage History
| Date | Status | Borrower | Loan Amount |
|---|---|---|---|
| Open | Rodriguez Andrei | $365,760 |
Source: Public Records
Tax History Compared to Growth
Tax History
| Year | Tax Paid | Tax Assessment Tax Assessment Total Assessment is a certain percentage of the fair market value that is determined by local assessors to be the total taxable value of land and additions on the property. | Land | Improvement |
|---|---|---|---|---|
| 2025 | $11,162 | $88,400 | $21,900 | $66,500 |
| 2024 | $10,837 | $88,400 | $21,900 | $66,500 |
| 2023 | $10,837 | $88,400 | $21,900 | $66,500 |
| 2022 | $10,545 | $88,400 | $21,900 | $66,500 |
| 2021 | $10,437 | $88,400 | $21,900 | $66,500 |
| 2020 | $10,097 | $88,400 | $21,900 | $66,500 |
| 2019 | $9,425 | $84,700 | $21,900 | $62,800 |
| 2018 | $9,239 | $84,700 | $21,900 | $62,800 |
| 2017 | $9,076 | $84,700 | $21,900 | $62,800 |
| 2016 | $9,002 | $84,700 | $21,900 | $62,800 |
| 2015 | $8,827 | $84,700 | $21,900 | $62,800 |
| 2014 | $8,634 | $84,700 | $21,900 | $62,800 |
Source: Public Records
Map
Nearby Homes
- 204 Marlin Dr
- 250 Ford Ave
- 30 Overlook Terrace
- 55 Murdock St
- 1008 Main St
- 891 Main St
- 37 Summit Ave
- 33 Larchmont Rd
- 38 Evergreen Ave
- 110 Sheppard Place
- 26 Wildwood Ave
- 29 Highland Terrace
- 59 Hearthstone Ave
- 25 Wildwood Ave
- 206 Arlington Dr
- 134 Beech St
- 141 Dunbar Ave
- 56 Ford Ave
- 46 3rd St
- 34 Maple Ave
- 197 Marlin Dr
- 161 Marlin Dr
- 205 Marlin Dr
- 147 Marlin Dr
- 147 Marlin Rd
- 190 Marlin Dr
- 133 Marlin Dr
- 242 Ford Ave
- 246 Ford Ave
- 220 Ford Ave
- 214 Ford Ave
- 73 Wilson Dr
- 105 Marlin Dr
- 212 Ford Ave
- 14 Overlook Terrace
- 10 Overlook Terrace
- 210 Ford Ave
- 18 Overlook Terrace
- 6 Overlook Terrace
- 22 Overlook Terrace