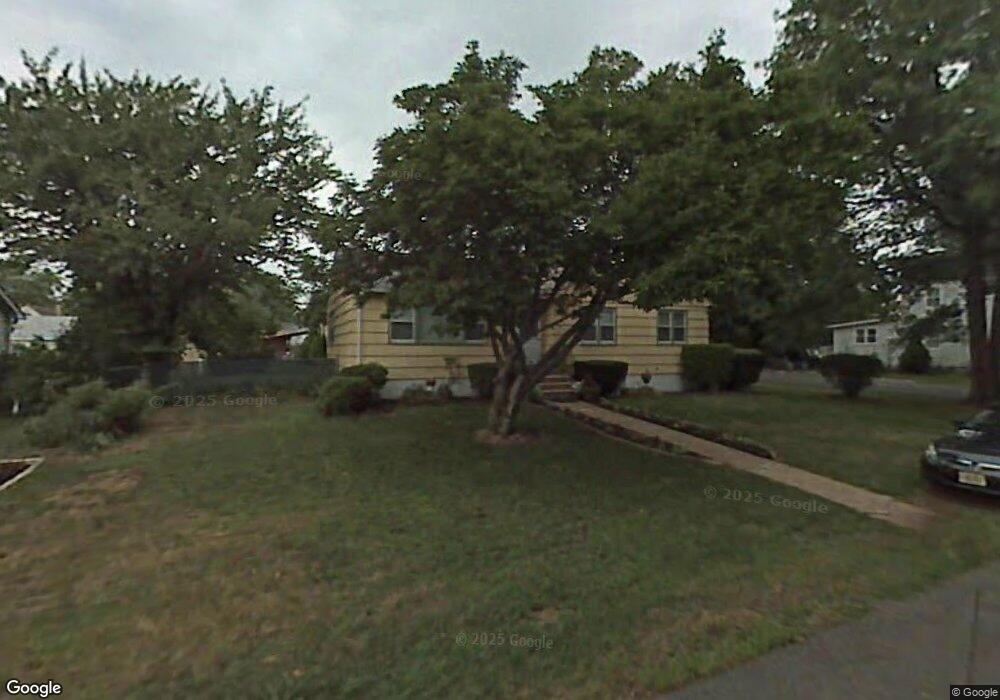
177 Myrtle St Somerset, NJ 08873
Estimated Value: $362,000 - $407,000
--
Bed
--
Bath
1,192
Sq Ft
$325/Sq Ft
Est. Value
About This Home
This home is located at 177 Myrtle St, Somerset, NJ 08873 and is currently estimated at $387,006, approximately $324 per square foot. 177 Myrtle St is a home located in Somerset County with nearby schools including Franklin High School.
Ownership History
Date
Name
Owned For
Owner Type
Purchase Details
Closed on
May 24, 2004
Sold by
Price Chad E
Bought by
Wright Cora Denson
Current Estimated Value
Home Financials for this Owner
Home Financials are based on the most recent Mortgage that was taken out on this home.
Original Mortgage
$204,250
Outstanding Balance
$98,317
Interest Rate
5.88%
Estimated Equity
$288,689
Purchase Details
Closed on
Aug 27, 1999
Sold by
Takacs John
Bought by
Price Chad and Johnson Jennifer
Home Financials for this Owner
Home Financials are based on the most recent Mortgage that was taken out on this home.
Original Mortgage
$103,000
Interest Rate
7.53%
Create a Home Valuation Report for This Property
The Home Valuation Report is an in-depth analysis detailing your home's value as well as a comparison with similar homes in the area
Home Values in the Area
Average Home Value in this Area
Purchase History
| Date | Buyer | Sale Price | Title Company |
|---|---|---|---|
| Wright Cora Denson | $215,000 | -- | |
| Price Chad | $129,000 | -- |
Source: Public Records
Mortgage History
| Date | Status | Borrower | Loan Amount |
|---|---|---|---|
| Open | Wright Cora Denson | $204,250 | |
| Previous Owner | Price Chad | $103,000 |
Source: Public Records
Tax History Compared to Growth
Tax History
| Year | Tax Paid | Tax Assessment Tax Assessment Total Assessment is a certain percentage of the fair market value that is determined by local assessors to be the total taxable value of land and additions on the property. | Land | Improvement |
|---|---|---|---|---|
| 2025 | $5,681 | $325,000 | $188,300 | $136,700 |
| 2024 | $5,681 | $311,800 | $218,300 | $93,500 |
| 2023 | $5,482 | $282,600 | $189,100 | $93,500 |
| 2022 | $5,378 | $262,600 | $169,100 | $93,500 |
| 2021 | $4,962 | $222,600 | $129,100 | $93,500 |
| 2020 | $4,977 | $217,600 | $124,100 | $93,500 |
| 2019 | $4,928 | $212,600 | $119,100 | $93,500 |
| 2018 | $4,394 | $187,600 | $94,100 | $93,500 |
| 2017 | $4,175 | $177,600 | $84,100 | $93,500 |
| 2016 | $4,258 | $179,600 | $86,100 | $93,500 |
| 2015 | $4,253 | $180,600 | $87,100 | $93,500 |
| 2014 | $4,213 | $181,600 | $88,100 | $93,500 |
Source: Public Records
Map
Nearby Homes