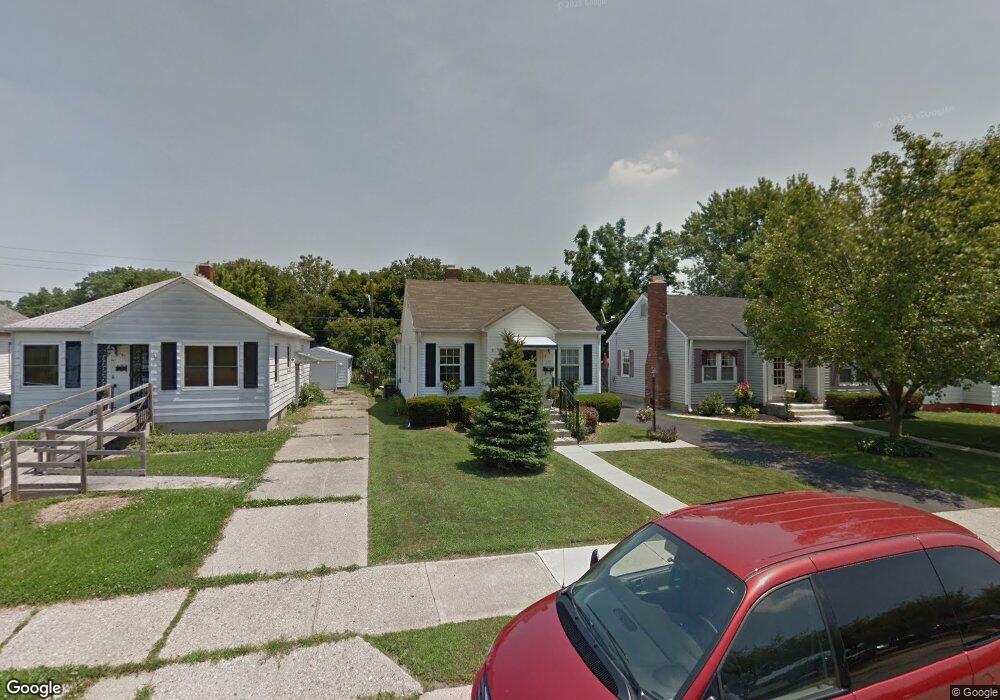
177 N 13th Ave Beech Grove, IN 46107
Estimated Value: $133,000 - $178,634
2
Beds
1
Bath
1,744
Sq Ft
$91/Sq Ft
Est. Value
About This Home
This home is located at 177 N 13th Ave, Beech Grove, IN 46107 and is currently estimated at $158,409, approximately $90 per square foot. 177 N 13th Ave is a home located in Marion County with nearby schools including Hornet Park Elementary School, Central Elementary School, and South Grove Intermediate School.
Ownership History
Date
Name
Owned For
Owner Type
Purchase Details
Closed on
Jan 29, 2021
Sold by
Alexander Oren
Bought by
Williams James Patrick
Current Estimated Value
Home Financials for this Owner
Home Financials are based on the most recent Mortgage that was taken out on this home.
Original Mortgage
$68,000
Outstanding Balance
$59,864
Interest Rate
2.6%
Mortgage Type
New Conventional
Estimated Equity
$98,545
Purchase Details
Closed on
Mar 19, 2007
Sold by
Jackson Alphonso
Bought by
Williams Julia C
Home Financials for this Owner
Home Financials are based on the most recent Mortgage that was taken out on this home.
Original Mortgage
$50,250
Interest Rate
6.27%
Mortgage Type
New Conventional
Purchase Details
Closed on
Aug 28, 2006
Sold by
Midfirst Bank
Bought by
Secretary Of Hud
Create a Home Valuation Report for This Property
The Home Valuation Report is an in-depth analysis detailing your home's value as well as a comparison with similar homes in the area
Home Values in the Area
Average Home Value in this Area
Purchase History
| Date | Buyer | Sale Price | Title Company |
|---|---|---|---|
| Williams James Patrick | -- | None Available | |
| Williams Julia C | -- | Village Title Inc | |
| Secretary Of Hud | -- | None Available | |
| Midfirst Bank | $91,026 | None Available |
Source: Public Records
Mortgage History
| Date | Status | Borrower | Loan Amount |
|---|---|---|---|
| Open | Williams James Patrick | $68,000 | |
| Previous Owner | Williams Julia C | $50,250 |
Source: Public Records
Tax History
| Year | Tax Paid | Tax Assessment Tax Assessment Total Assessment is a certain percentage of the fair market value that is determined by local assessors to be the total taxable value of land and additions on the property. | Land | Improvement |
|---|---|---|---|---|
| 2025 | $1,940 | $146,100 | $18,600 | $127,500 |
| 2024 | $1,907 | $147,200 | $18,600 | $128,600 |
| 2023 | $1,907 | $142,800 | $18,600 | $124,200 |
| 2022 | $1,912 | $128,400 | $18,600 | $109,800 |
| 2021 | $1,499 | $115,100 | $18,600 | $96,500 |
| 2020 | $1,285 | $105,000 | $18,600 | $86,400 |
| 2019 | $1,080 | $92,200 | $11,100 | $81,100 |
| 2018 | $975 | $86,000 | $11,100 | $74,900 |
| 2017 | $971 | $84,400 | $11,100 | $73,300 |
| 2016 | $927 | $81,500 | $11,100 | $70,400 |
| 2014 | $843 | $77,200 | $11,100 | $66,100 |
| 2013 | $930 | $77,200 | $11,100 | $66,100 |
Source: Public Records
Map
Nearby Homes
- 181 N 13th Ave
- 173 N 13th Ave
- 185 N 13th Ave
- 169 N 13th Ave
- 189 N 13th Ave
- 167 N 13th Ave
- 188 N 13th Ave
- 163 N 13th Ave
- 192 N 13th Ave
- 203 N 13th Ave
- 159 N 13th Ave
- 207 N 13th Ave
- 1367 Buffalo St
- 200 N 13th Ave
- 155 N 13th Ave
- 208 N 13th Ave
- 211 N 13th Ave
- 214 N 13th Ave
- 215 N 13th Ave
- 201 N 14th Ave
Your Personal Tour Guide
Ask me questions while you tour the home.