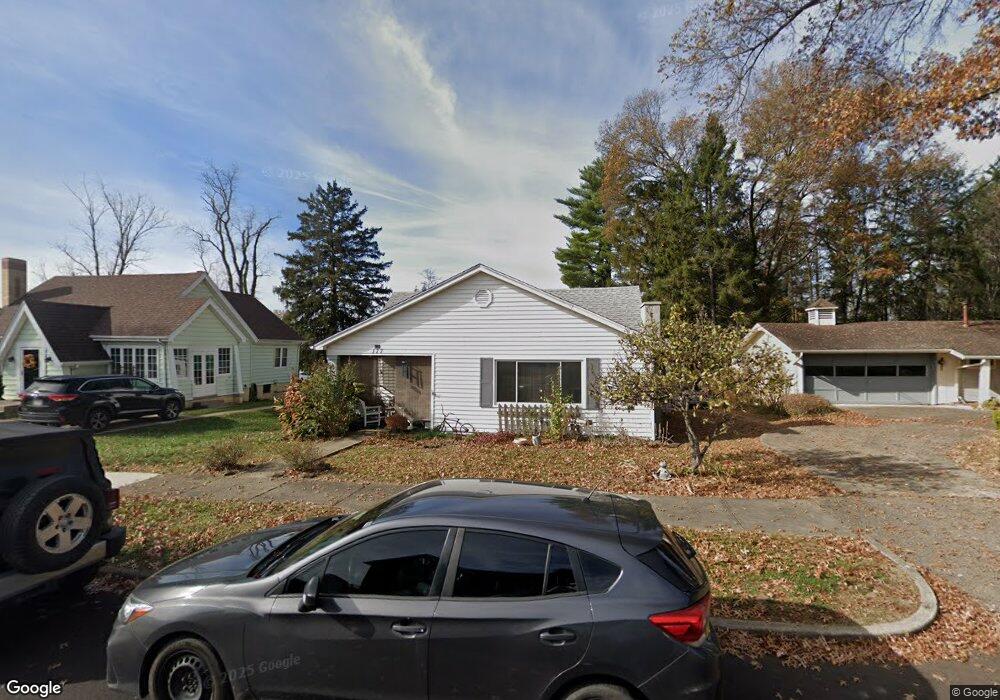
177 N High St Jackson, OH 45640
Estimated Value: $119,000 - $193,000
2
Beds
2
Baths
1,472
Sq Ft
$113/Sq Ft
Est. Value
About This Home
This home is located at 177 N High St, Jackson, OH 45640 and is currently estimated at $166,333, approximately $112 per square foot. 177 N High St is a home located in Jackson County with nearby schools including Jackson High School and Christian Life Academy.
Ownership History
Date
Name
Owned For
Owner Type
Purchase Details
Closed on
Mar 9, 2020
Sold by
Jarvis Stephanie M and Estate Of Christopher C Waulk
Bought by
Dulancy Danielle R
Current Estimated Value
Home Financials for this Owner
Home Financials are based on the most recent Mortgage that was taken out on this home.
Original Mortgage
$45,500
Outstanding Balance
$30,097
Interest Rate
3.5%
Mortgage Type
New Conventional
Estimated Equity
$136,236
Purchase Details
Closed on
Dec 20, 2006
Sold by
Parks Mclanie S
Bought by
Waulk Christopher C
Purchase Details
Closed on
Jul 8, 2006
Sold by
Parsk William R and Parsk Margaret Elizabeth
Bought by
Parks Melanie S
Create a Home Valuation Report for This Property
The Home Valuation Report is an in-depth analysis detailing your home's value as well as a comparison with similar homes in the area
Home Values in the Area
Average Home Value in this Area
Purchase History
| Date | Buyer | Sale Price | Title Company |
|---|---|---|---|
| Dulancy Danielle R | $44,600 | Northwest Title Agency | |
| Waulk Christopher C | $55,000 | Attorney | |
| Parks Melanie S | $1,000 | None Available |
Source: Public Records
Mortgage History
| Date | Status | Borrower | Loan Amount |
|---|---|---|---|
| Open | Dulancy Danielle R | $45,500 |
Source: Public Records
Tax History
| Year | Tax Paid | Tax Assessment Tax Assessment Total Assessment is a certain percentage of the fair market value that is determined by local assessors to be the total taxable value of land and additions on the property. | Land | Improvement |
|---|---|---|---|---|
| 2025 | $1,600 | $44,570 | $6,380 | $38,190 |
| 2024 | $1,615 | $44,570 | $6,380 | $38,190 |
| 2023 | $1,643 | $44,570 | $6,380 | $38,190 |
| 2022 | $1,702 | $33,380 | $6,000 | $27,380 |
| 2021 | $1,328 | $33,380 | $6,000 | $27,380 |
| 2020 | $1,315 | $33,380 | $6,000 | $27,380 |
| 2019 | $1,189 | $29,540 | $5,310 | $24,230 |
| 2018 | $1,145 | $29,540 | $5,310 | $24,230 |
| 2017 | $548 | $29,540 | $5,310 | $24,230 |
| 2016 | $940 | $25,030 | $3,740 | $21,290 |
| 2015 | $946 | $25,030 | $3,740 | $21,290 |
| 2013 | $904 | $23,990 | $3,740 | $20,250 |
| 2012 | $1,039 | $27,170 | $5,200 | $21,970 |
Source: Public Records
Map
Nearby Homes
Your Personal Tour Guide
Ask me questions while you tour the home.