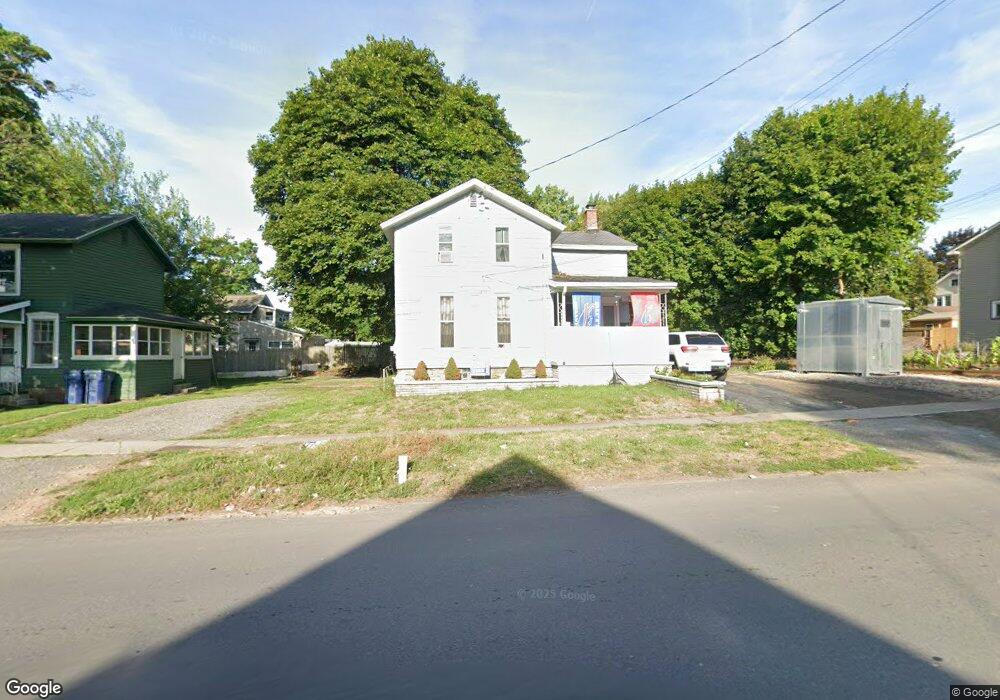
177 N Transit St Lockport, NY 14094
Estimated Value: $143,000 - $158,000
3
Beds
1
Bath
1,552
Sq Ft
$98/Sq Ft
Est. Value
About This Home
This home is located at 177 N Transit St, Lockport, NY 14094 and is currently estimated at $151,639, approximately $97 per square foot. 177 N Transit St is a home located in Niagara County with nearby schools including Aaron Mossell Junior High School, Lockport High School, and DeSales Catholic School.
Ownership History
Date
Name
Owned For
Owner Type
Purchase Details
Closed on
Mar 29, 2017
Sold by
City Of Lockport New York
Bought by
Freeman Rico
Current Estimated Value
Purchase Details
Closed on
Dec 23, 2009
Sold by
Jones William L
Bought by
Defranco Carl F
Purchase Details
Closed on
Jul 3, 2009
Sold by
Rome Holdings 1 Llc
Bought by
Jones As Trustee William
Purchase Details
Closed on
Sep 20, 2007
Sold by
Kaiser Jeremy
Bought by
Rome Holdings 1 Llc
Purchase Details
Closed on
Feb 24, 2005
Sold by
Pearson Craig
Bought by
Ortiz Victor
Purchase Details
Closed on
Oct 24, 2003
Sold by
Countrywide Home Loans Llc
Bought by
Pearson Craig
Purchase Details
Closed on
Feb 27, 2003
Sold by
Yarborough Phyllis By Referee
Bought by
Aames Home Loan
Purchase Details
Closed on
Apr 16, 2001
Sold by
Lannen Robert E
Bought by
Yarborough Phyllis
Purchase Details
Closed on
Mar 30, 2000
Sold by
Willis Barton Estate
Bought by
Lannen Robert E
Create a Home Valuation Report for This Property
The Home Valuation Report is an in-depth analysis detailing your home's value as well as a comparison with similar homes in the area
Home Values in the Area
Average Home Value in this Area
Purchase History
| Date | Buyer | Sale Price | Title Company |
|---|---|---|---|
| Freeman Rico | $8,000 | None Available | |
| Defranco Carl F | -- | None Available | |
| Jones As Trustee William | -- | -- | |
| Jones William L | -- | None Available | |
| Rome Holdings 1 Llc | $15,999 | Charles Ben | |
| Kaiser Jeremy | $13,500 | Charles Ben | |
| Ortiz Victor | $14,600 | Patrick M Balkin | |
| Pearson Craig | $9,000 | -- | |
| Aames Home Loan | $65,598 | Ted May | |
| Yarborough Phyllis | $42,000 | -- | |
| Lannen Robert E | $8,500 | Randy H Gugino |
Source: Public Records
Tax History Compared to Growth
Tax History
| Year | Tax Paid | Tax Assessment Tax Assessment Total Assessment is a certain percentage of the fair market value that is determined by local assessors to be the total taxable value of land and additions on the property. | Land | Improvement |
|---|---|---|---|---|
| 2024 | $4,184 | $113,000 | $2,700 | $110,300 |
| 2023 | $4,154 | $109,000 | $2,700 | $106,300 |
| 2022 | $2,135 | $99,000 | $2,700 | $96,300 |
| 2021 | $1,368 | $34,700 | $3,400 | $31,300 |
| 2020 | $1,339 | $34,700 | $3,400 | $31,300 |
| 2019 | $965 | $34,700 | $3,400 | $31,300 |
| 2018 | $968 | $34,700 | $3,400 | $31,300 |
| 2017 | $965 | $34,700 | $3,400 | $31,300 |
| 2016 | $934 | $34,700 | $3,400 | $31,300 |
| 2015 | -- | $34,700 | $3,400 | $31,300 |
| 2014 | -- | $34,700 | $3,400 | $31,300 |
Source: Public Records
Map
Nearby Homes
- 149 Green St
- 301 Hawley St
- 59 Ontario St
- 128 Ontario St
- 43 Prentice St
- 258 Grand St
- 66 Grand St
- 62 Grand St
- 129 Lock St
- 359 N Transit St
- 471 Hawley St
- 370 Green St
- 27 Saxton St
- 7051 James Francis Dr
- Cambridge Plan at Lincoln Woods
- Devonshire Plan at Lincoln Woods
- Eastbrook Plan at Lincoln Woods
- Concorde Plan at Lincoln Woods
- Fenway II Plan at Lincoln Woods
- Brighton Plan at Lincoln Woods
- 131 Caledonia St
- 185 N Transit St
- 141 Caledonia St
- 178 Green St
- 178 N Transit St
- 176 N Transit St
- 182 N Transit St
- 184 Green St
- 170 Green St
- 174 Green St
- 145 Caledonia St
- 145 Caledonia St Unit 2E
- 145 Caledonia St
- 186 Green St
- 149 Caledonia St
- 109 Caledonia St
- 153 Caledonia St
- 105 Caledonia St
- 149 N Transit St
- 157 Caledonia St