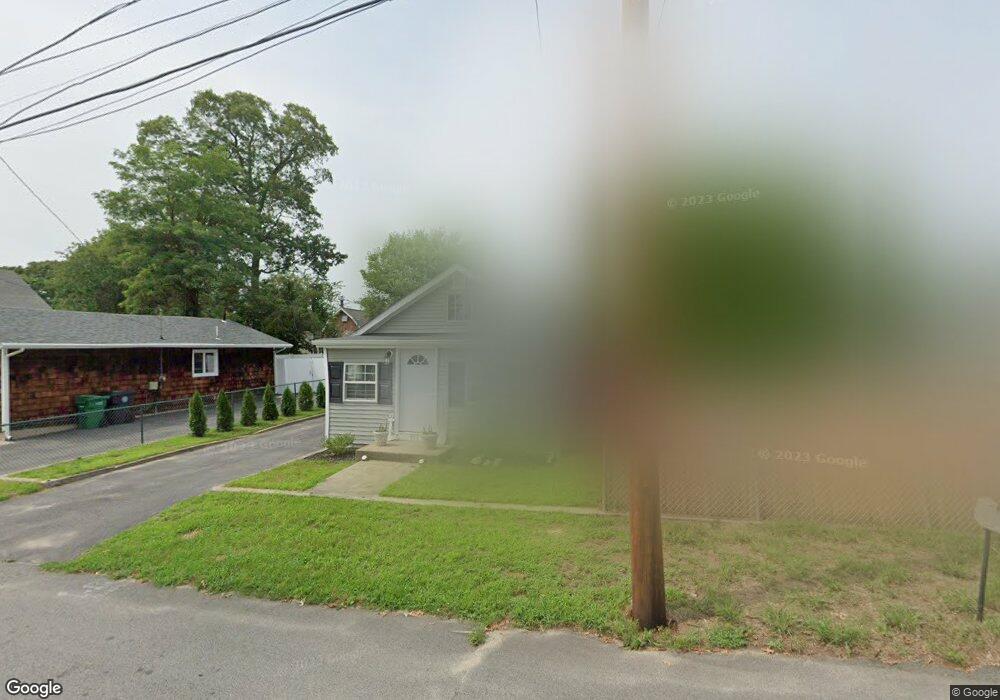
177 Northrup St Warwick, RI 02889
Natick NeighborhoodEstimated Value: $276,000 - $327,000
1
Bed
1
Bath
504
Sq Ft
$617/Sq Ft
Est. Value
About This Home
This home is located at 177 Northrup St, Warwick, RI 02889 and is currently estimated at $310,927, approximately $616 per square foot. 177 Northrup St is a home located in Kent County with nearby schools including Nel/Cps Construction Career, Islamic School of Rhode Island, and St Joseph School.
Ownership History
Date
Name
Owned For
Owner Type
Purchase Details
Closed on
Nov 30, 2020
Sold by
Mandeville George
Bought by
Sepe Christina
Current Estimated Value
Home Financials for this Owner
Home Financials are based on the most recent Mortgage that was taken out on this home.
Original Mortgage
$194,750
Outstanding Balance
$172,904
Interest Rate
2.8%
Mortgage Type
New Conventional
Estimated Equity
$138,023
Purchase Details
Closed on
Mar 20, 2020
Sold by
Rwr Real Estate Inv Group
Bought by
Mandeville George
Purchase Details
Closed on
May 27, 2016
Sold by
Urso Lori
Bought by
Ferri Mark
Home Financials for this Owner
Home Financials are based on the most recent Mortgage that was taken out on this home.
Original Mortgage
$107,025
Interest Rate
3.58%
Mortgage Type
FHA
Purchase Details
Closed on
Jul 28, 2009
Sold by
Bank Of America Na
Bought by
Urso Lori
Purchase Details
Closed on
Nov 20, 2008
Sold by
Zommer Edward and Bank Of America Na
Bought by
Bank Of America Na
Purchase Details
Closed on
Jul 18, 2006
Sold by
Hopkins Lynn C
Bought by
Zommer Edward and Brehio Tracie A
Purchase Details
Closed on
Aug 23, 2004
Sold by
Frechette Terri S
Bought by
Hopkins Lynn Claire
Purchase Details
Closed on
May 11, 2001
Sold by
Oleary Edward R and Oleary Nellie
Bought by
Frechette Terri Sue
Create a Home Valuation Report for This Property
The Home Valuation Report is an in-depth analysis detailing your home's value as well as a comparison with similar homes in the area
Home Values in the Area
Average Home Value in this Area
Purchase History
| Date | Buyer | Sale Price | Title Company |
|---|---|---|---|
| Sepe Christina | $205,000 | None Available | |
| Sepe Christina | $205,000 | None Available | |
| Mandeville George | $98,000 | None Available | |
| Mandeville George | $98,000 | None Available | |
| Ferri Mark | $109,000 | -- | |
| Ferri Mark | $109,000 | -- | |
| Urso Lori | $47,500 | -- | |
| Urso Lori | $47,500 | -- | |
| Bank Of America Na | $88,000 | -- | |
| Bank Of America Na | $88,000 | -- | |
| Zommer Edward | $140,000 | -- | |
| Zommer Edward | $140,000 | -- | |
| Hopkins Lynn Claire | $101,000 | -- | |
| Hopkins Lynn Claire | $101,000 | -- | |
| Frechette Terri Sue | $62,000 | -- | |
| Frechette Terri Sue | $62,000 | -- |
Source: Public Records
Mortgage History
| Date | Status | Borrower | Loan Amount |
|---|---|---|---|
| Open | Sepe Christina | $194,750 | |
| Previous Owner | Ferri Mark | $107,025 | |
| Previous Owner | Frechette Terri Sue | $41,200 |
Source: Public Records
Tax History
| Year | Tax Paid | Tax Assessment Tax Assessment Total Assessment is a certain percentage of the fair market value that is determined by local assessors to be the total taxable value of land and additions on the property. | Land | Improvement |
|---|---|---|---|---|
| 2025 | $3,583 | $282,100 | $92,400 | $189,700 |
| 2024 | $3,289 | $227,300 | $74,600 | $152,700 |
| 2023 | $3,225 | $227,300 | $74,600 | $152,700 |
| 2022 | $3,109 | $166,000 | $44,800 | $121,200 |
| 2021 | $3,109 | $166,000 | $44,800 | $121,200 |
| 2020 | $2,238 | $119,500 | $44,800 | $74,700 |
| 2019 | $2,238 | $119,500 | $44,800 | $74,700 |
| 2018 | $1,793 | $88,600 | $41,600 | $47,000 |
| 2017 | $1,793 | $88,600 | $41,600 | $47,000 |
| 2016 | $1,793 | $88,600 | $41,600 | $47,000 |
| 2015 | $1,778 | $85,700 | $46,400 | $39,300 |
| 2014 | $1,719 | $85,700 | $46,400 | $39,300 |
| 2013 | $1,696 | $85,700 | $46,400 | $39,300 |
Source: Public Records
Map
Nearby Homes
- 5 High St
- 14 W Natick Rd
- 36 Bleachery Ct
- 1027 Providence St Unit 4B
- 104 James St
- 112 James St
- 50 Briarwood Rd
- 115 Edman St
- 123 Edman St
- 10 East St Unit 316
- 12 Railroad Row
- 42 Woodland Dr
- 14 Amanda St
- 61 Crossland Rd
- 69 Haverhill Ave
- 993 Williamsburg Cir
- 892 Halifax Dr
- 78 Wilbur Ave
- 25 Wilson St
- 20 Manilla Ave
Your Personal Tour Guide
Ask me questions while you tour the home.