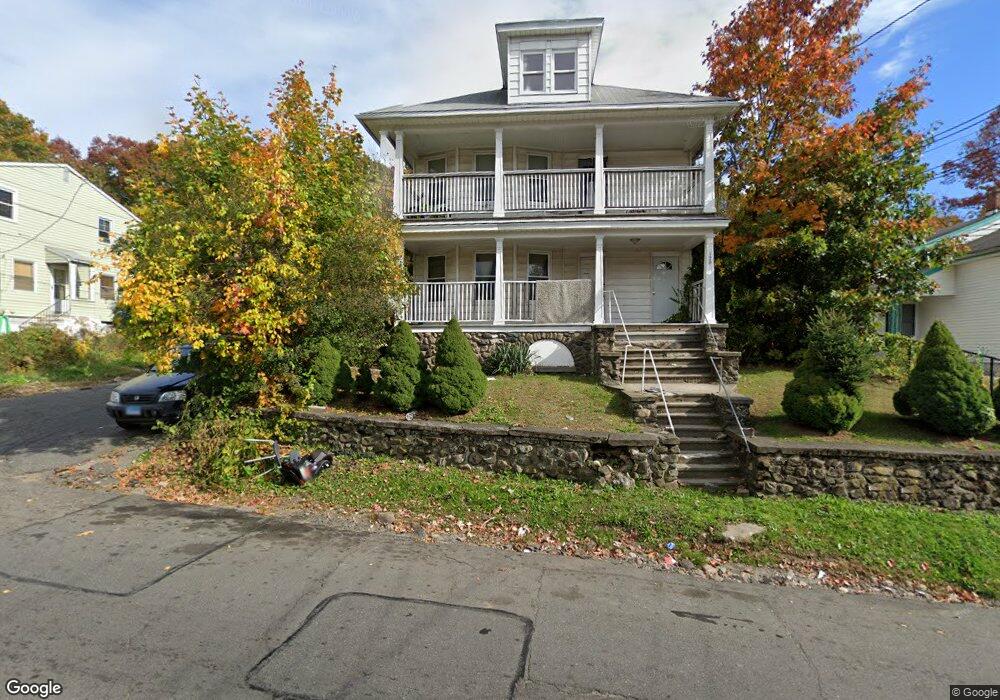
177 Oak St Waterbury, CT 06704
North End District NeighborhoodEstimated Value: $260,812 - $446,000
4
Beds
2
Baths
2,636
Sq Ft
$140/Sq Ft
Est. Value
About This Home
This home is located at 177 Oak St, Waterbury, CT 06704 and is currently estimated at $368,703, approximately $139 per square foot. 177 Oak St is a home located in New Haven County with nearby schools including Woodrow Wilson School, Michael F. Wallace Middle School, and Crosby High School.
Ownership History
Date
Name
Owned For
Owner Type
Purchase Details
Closed on
Sep 8, 2008
Sold by
Us Bank Na
Bought by
Barbieri Joseph
Current Estimated Value
Purchase Details
Closed on
Apr 28, 2003
Sold by
Condos Llc
Bought by
Porter Michael R
Purchase Details
Closed on
Dec 23, 2002
Sold by
Chase Manhattan Bk
Bought by
Condos Llc
Purchase Details
Closed on
Jun 17, 1996
Sold by
Albini Robert L
Bought by
Cosme Rafael A
Purchase Details
Closed on
May 8, 1996
Sold by
Diorio Robin M
Bought by
Albini Robert L
Create a Home Valuation Report for This Property
The Home Valuation Report is an in-depth analysis detailing your home's value as well as a comparison with similar homes in the area
Home Values in the Area
Average Home Value in this Area
Purchase History
| Date | Buyer | Sale Price | Title Company |
|---|---|---|---|
| Barbieri Joseph | $47,000 | -- | |
| Porter Michael R | $115,000 | -- | |
| Condos Llc | $53,000 | -- | |
| Cosme Rafael A | $89,900 | -- | |
| Albini Robert L | $22,500 | -- |
Source: Public Records
Mortgage History
| Date | Status | Borrower | Loan Amount |
|---|---|---|---|
| Open | Albini Robert L | $50,000 | |
| Open | Albini Robert L | $206,341 |
Source: Public Records
Tax History Compared to Growth
Tax History
| Year | Tax Paid | Tax Assessment Tax Assessment Total Assessment is a certain percentage of the fair market value that is determined by local assessors to be the total taxable value of land and additions on the property. | Land | Improvement |
|---|---|---|---|---|
| 2025 | $6,395 | $142,170 | $11,410 | $130,760 |
| 2024 | $7,029 | $142,170 | $11,410 | $130,760 |
| 2023 | $7,704 | $142,170 | $11,410 | $130,760 |
| 2022 | $4,050 | $67,260 | $11,380 | $55,880 |
| 2021 | $4,050 | $67,260 | $11,380 | $55,880 |
| 2020 | $4,050 | $67,260 | $11,380 | $55,880 |
| 2019 | $4,050 | $67,260 | $11,380 | $55,880 |
| 2018 | $4,050 | $67,260 | $11,380 | $55,880 |
| 2017 | $4,005 | $66,520 | $11,370 | $55,150 |
| 2016 | $4,005 | $66,520 | $11,370 | $55,150 |
| 2015 | $3,873 | $66,520 | $11,370 | $55,150 |
| 2014 | $3,896 | $66,910 | $11,380 | $55,530 |
Source: Public Records
Map
Nearby Homes