Estimated Value: $316,295 - $446,000
3
Beds
2
Baths
1,985
Sq Ft
$185/Sq Ft
Est. Value
About This Home
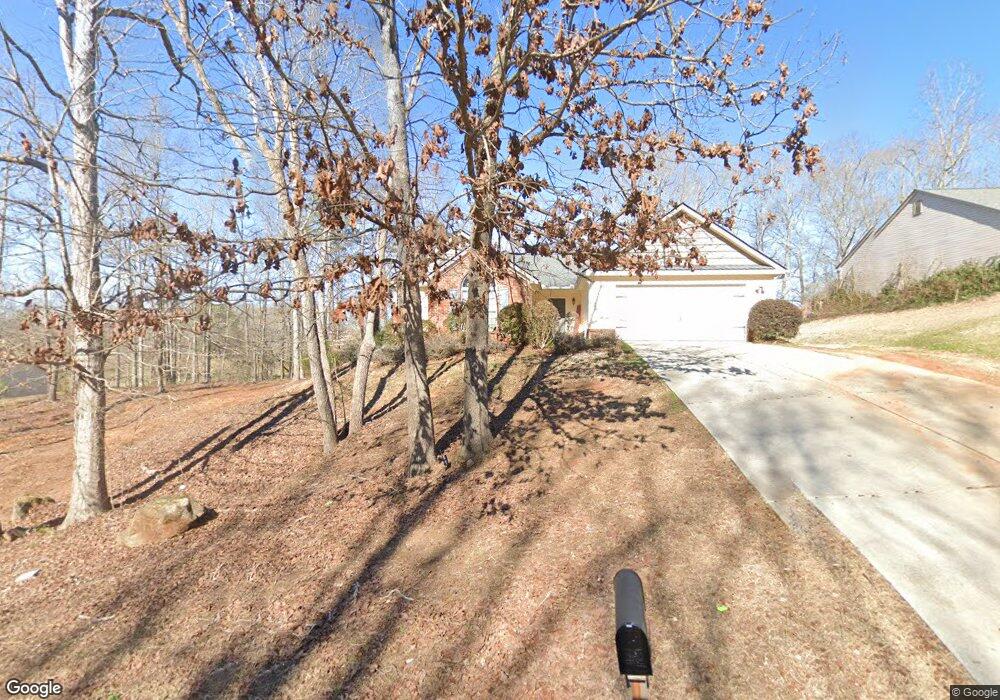
This home is located at 177 Oakview Dr, Hull, GA 30646 and is currently estimated at $367,324, approximately $185 per square foot. 177 Oakview Dr is a home located in Madison County with nearby schools including Madison County High School.
Ownership History
Date
Name
Owned For
Owner Type
Purchase Details
Closed on
Jul 8, 2022
Sold by
Hill Tamerion L
Bought by
Hill Tamerion L and Wilson Bomani Odero
Current Estimated Value
Home Financials for this Owner
Home Financials are based on the most recent Mortgage that was taken out on this home.
Original Mortgage
$183,000
Outstanding Balance
$173,564
Interest Rate
5.23%
Mortgage Type
New Conventional
Estimated Equity
$193,760
Purchase Details
Closed on
Nov 24, 2010
Sold by
Lents Clay A
Bought by
Hill Tamerison L
Home Financials for this Owner
Home Financials are based on the most recent Mortgage that was taken out on this home.
Original Mortgage
$134,466
Interest Rate
4.31%
Mortgage Type
New Conventional
Purchase Details
Closed on
Apr 30, 2007
Sold by
Star Home Builders Inc
Bought by
Lents Clay A and Lents Angela D
Home Financials for this Owner
Home Financials are based on the most recent Mortgage that was taken out on this home.
Original Mortgage
$143,900
Interest Rate
6.11%
Mortgage Type
New Conventional
Create a Home Valuation Report for This Property
The Home Valuation Report is an in-depth analysis detailing your home's value as well as a comparison with similar homes in the area
Purchase History
| Date | Buyer | Sale Price | Title Company |
|---|---|---|---|
| Hill Tamerion L | -- | -- | |
| Hill Tamerison L | $129,760 | -- | |
| Lents Clay A | $159,900 | -- |
Source: Public Records
Mortgage History
| Date | Status | Borrower | Loan Amount |
|---|---|---|---|
| Open | Hill Tamerion L | $183,000 | |
| Previous Owner | Hill Tamerison L | $134,466 | |
| Previous Owner | Lents Clay A | $143,900 |
Source: Public Records
Tax History
| Year | Tax Paid | Tax Assessment Tax Assessment Total Assessment is a certain percentage of the fair market value that is determined by local assessors to be the total taxable value of land and additions on the property. | Land | Improvement |
|---|---|---|---|---|
| 2025 | $2,425 | $97,438 | $12,600 | $84,838 |
| 2024 | $2,413 | $94,710 | $12,600 | $82,110 |
| 2023 | $2,725 | $89,278 | $12,600 | $76,678 |
| 2022 | $2,137 | $79,461 | $12,600 | $66,861 |
| 2021 | $1,839 | $62,242 | $12,600 | $49,642 |
| 2020 | $1,852 | $62,242 | $12,600 | $49,642 |
| 2019 | $1,839 | $61,146 | $12,600 | $48,546 |
| 2018 | $1,792 | $59,460 | $12,600 | $46,860 |
| 2017 | $1,720 | $59,723 | $12,600 | $47,123 |
| 2016 | $1,603 | $57,852 | $12,600 | $45,252 |
| 2015 | $1,372 | $49,790 | $7,200 | $42,590 |
| 2014 | $1,380 | $49,760 | $7,200 | $42,560 |
| 2013 | -- | $49,760 | $7,200 | $42,560 |
Source: Public Records
Map
Nearby Homes
- 103 Three Rivers Ct
- 450 Candlestick Dr
- 210 Joe Graham Rd
- 1151 Kimberly Cir
- 1067 Garnett Ward Rd Unit 2
- 1176 Kimberly Cir
- 151 Rolling Woods Ln
- 975 Diamond Hill Neese Rd
- 0 Reese Ln Unit 7703910
- 0 Reese Ln Unit CL346847
- 1360 Glenn Carrie Rd
- 8986 Highway 29 S
- 0 Spratlin Mill Dr Unit 7665837
- 0 Spratlin Mill Dr Unit LOT 14-C
- 181 Bedford Dr
- 838 Virginia Ln
- 789 Glenn Carrie Rd
- 1330 McCannon-morris Rd
- 00 Spratlin Mill Rd
- 142 Rolling Woods Ln Unit 29
- 177 Oak View Dr
- 177 Oak View Dr Unit lot4
- 187 Oak View Dr
- 187 Oakview Dr
- 137 Oakview Dr
- 137 Oak View Dr
- 162 Oak View Dr
- 162 Oakview Dr
- 178 Oak View Dr
- 178 Oak View Drive Lot12
- 178 Oakview Dr
- 162 Oak View Drive Lot13
- 223 Oak View Drive Lot5
- 223 Oakview Dr
- 220 Oakview Dr
- 220 Oak View Dr
- 220 Oak View Dr Unit lot11
- 242 Oak View Dr
- 242 Oakview Dr
- 242 Oak View Drive Lot10