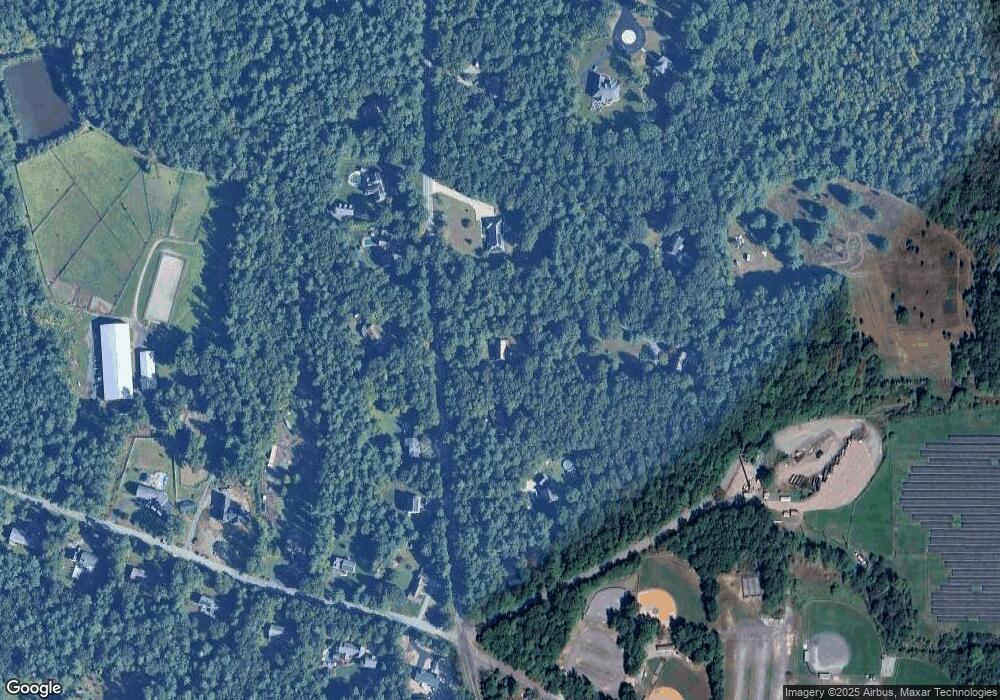
177 Plain St Rehoboth, MA 02769
Estimated Value: $657,387 - $779,000
3
Beds
1
Bath
1,900
Sq Ft
$381/Sq Ft
Est. Value
About This Home
This home is located at 177 Plain St, Rehoboth, MA 02769 and is currently estimated at $723,097, approximately $380 per square foot. 177 Plain St is a home located in Bristol County with nearby schools including Dighton-Rehoboth Regional High School.
Ownership History
Date
Name
Owned For
Owner Type
Purchase Details
Closed on
Jul 15, 2002
Sold by
Iodice Wayne J and Iodice Jane C
Bought by
Hunt David M and Hunt Michaelle A
Current Estimated Value
Home Financials for this Owner
Home Financials are based on the most recent Mortgage that was taken out on this home.
Original Mortgage
$283,700
Interest Rate
6.79%
Mortgage Type
Purchase Money Mortgage
Create a Home Valuation Report for This Property
The Home Valuation Report is an in-depth analysis detailing your home's value as well as a comparison with similar homes in the area
Home Values in the Area
Average Home Value in this Area
Purchase History
| Date | Buyer | Sale Price | Title Company |
|---|---|---|---|
| Hunt David M | $292,500 | -- |
Source: Public Records
Mortgage History
| Date | Status | Borrower | Loan Amount |
|---|---|---|---|
| Open | Hunt David M | $261,000 | |
| Closed | Hunt David M | $246,000 | |
| Closed | Hunt David M | $283,700 |
Source: Public Records
Tax History
| Year | Tax Paid | Tax Assessment Tax Assessment Total Assessment is a certain percentage of the fair market value that is determined by local assessors to be the total taxable value of land and additions on the property. | Land | Improvement |
|---|---|---|---|---|
| 2025 | $58 | $519,700 | $173,200 | $346,500 |
| 2024 | $5,314 | $467,800 | $173,200 | $294,600 |
| 2023 | $4,941 | $459,200 | $169,600 | $289,600 |
| 2022 | $4,941 | $390,000 | $169,600 | $220,400 |
| 2021 | $5,093 | $384,700 | $161,800 | $222,900 |
| 2020 | $4,948 | $377,100 | $161,800 | $215,300 |
| 2018 | $4,027 | $336,400 | $154,000 | $182,400 |
| 2017 | $3,907 | $311,100 | $154,000 | $157,100 |
| 2016 | $3,688 | $303,500 | $154,000 | $149,500 |
| 2015 | $3,952 | $321,000 | $146,800 | $174,200 |
| 2014 | $3,747 | $301,200 | $139,600 | $161,600 |
Source: Public Records
Map
Nearby Homes
Your Personal Tour Guide
Ask me questions while you tour the home.