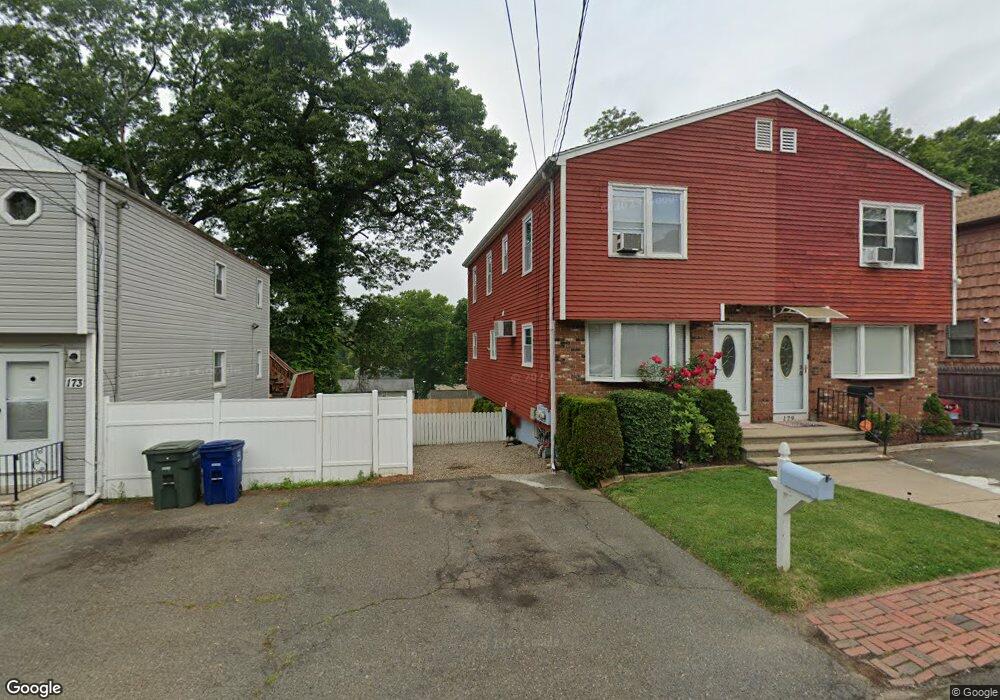
177 Robert St Bridgeport, CT 06606
Reservoir-Whiskey Hill NeighborhoodEstimated Value: $284,000 - $392,000
3
Beds
2
Baths
1,296
Sq Ft
$259/Sq Ft
Est. Value
About This Home
This home is located at 177 Robert St, Bridgeport, CT 06606 and is currently estimated at $335,278, approximately $258 per square foot. 177 Robert St is a home located in Fairfield County with nearby schools including Hallen School, Central High School, and Northeastern Adventist Academy - Fairfield County.
Ownership History
Date
Name
Owned For
Owner Type
Purchase Details
Closed on
Jul 27, 2011
Sold by
Patterson Deon
Bought by
Patterson Courtney
Current Estimated Value
Purchase Details
Closed on
Sep 9, 2004
Sold by
Bonheur Moise and Bonheur Margalie
Bought by
Patterson Deon and Patterson Courtney
Home Financials for this Owner
Home Financials are based on the most recent Mortgage that was taken out on this home.
Original Mortgage
$144,900
Interest Rate
6.08%
Purchase Details
Closed on
Apr 28, 1991
Sold by
Brenneis Joseph and Brenneis Deborah
Bought by
Bonheur Andre and Bonheur Margalie
Create a Home Valuation Report for This Property
The Home Valuation Report is an in-depth analysis detailing your home's value as well as a comparison with similar homes in the area
Home Values in the Area
Average Home Value in this Area
Purchase History
| Date | Buyer | Sale Price | Title Company |
|---|---|---|---|
| Patterson Courtney | -- | -- | |
| Patterson Courtney | -- | -- | |
| Patterson Deon | $144,900 | -- | |
| Patterson Deon | $144,900 | -- | |
| Bonheur Andre | $87,000 | -- |
Source: Public Records
Mortgage History
| Date | Status | Borrower | Loan Amount |
|---|---|---|---|
| Previous Owner | Bonheur Andre | $180,000 | |
| Previous Owner | Bonheur Andre | $144,900 |
Source: Public Records
Tax History Compared to Growth
Tax History
| Year | Tax Paid | Tax Assessment Tax Assessment Total Assessment is a certain percentage of the fair market value that is determined by local assessors to be the total taxable value of land and additions on the property. | Land | Improvement |
|---|---|---|---|---|
| 2025 | $5,967 | $137,320 | $25,340 | $111,980 |
| 2024 | $5,967 | $137,320 | $25,340 | $111,980 |
| 2023 | $5,967 | $137,320 | $25,340 | $111,980 |
| 2022 | $5,967 | $137,320 | $25,340 | $111,980 |
| 2021 | $5,967 | $137,320 | $25,340 | $111,980 |
| 2020 | $4,679 | $86,660 | $11,980 | $74,680 |
| 2019 | $4,679 | $86,660 | $11,980 | $74,680 |
| 2018 | $4,712 | $86,660 | $11,980 | $74,680 |
| 2017 | $4,712 | $86,660 | $11,980 | $74,680 |
| 2016 | $4,712 | $86,660 | $11,980 | $74,680 |
| 2015 | $4,721 | $111,880 | $16,180 | $95,700 |
| 2014 | $4,721 | $111,880 | $16,180 | $95,700 |
Source: Public Records
Map
Nearby Homes
- 45 Polk St
- 385 Chamberlain Ave
- 355 Chamberlain Ave
- 245 Indian Ave
- 235 Indian Ave
- 138 Infield St
- 130 Wilkins Ave
- 110 Wilkins Ave
- 28 Wilkins Ave
- 330 Oakwood St
- 39 Infield St
- 123 Exeter St
- 769 Sylvan Ave Unit 16
- 769 Sylvan Ave Unit 13
- 285 Alba Ave
- 500 Woodlawn Avenue Extension
- 717 Reservoir Ave
- 705 Reservoir Ave
- 410 Alba Ave
- 15 Edwards St