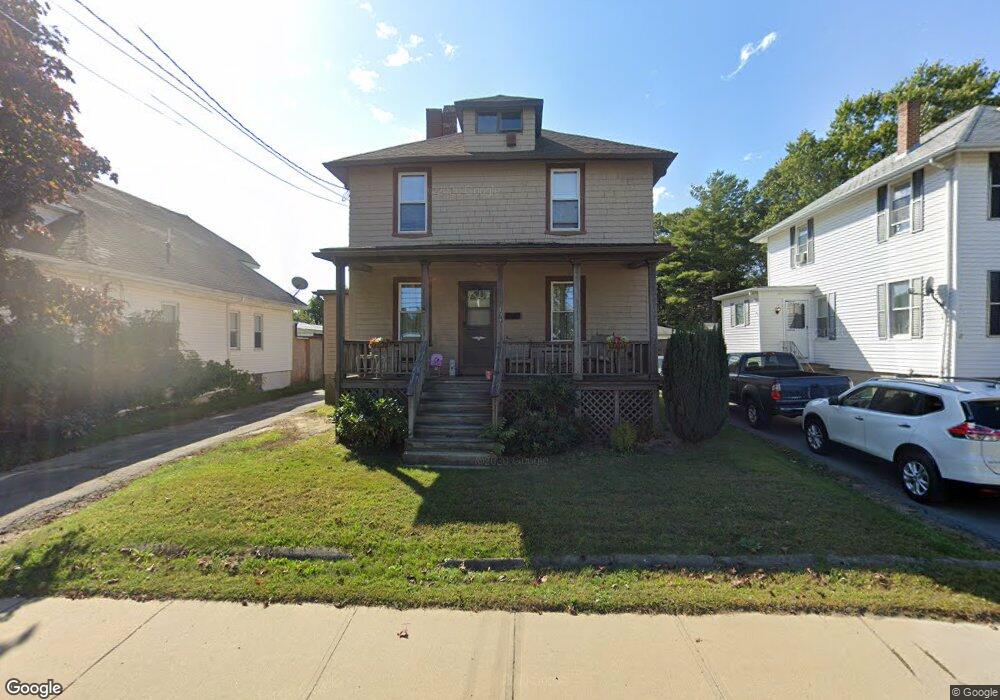
177 S Main St Acushnet, MA 02743
Estimated Value: $390,000 - $484,000
3
Beds
2
Baths
1,670
Sq Ft
$259/Sq Ft
Est. Value
About This Home
This home is located at 177 S Main St, Acushnet, MA 02743 and is currently estimated at $433,034, approximately $259 per square foot. 177 S Main St is a home located in Bristol County with nearby schools including Acushnet Elementary School, Albert F Ford Middle School, and Alma Del Mar Charter School.
Ownership History
Date
Name
Owned For
Owner Type
Purchase Details
Closed on
Aug 28, 2008
Sold by
Souza Cheryl L and Souza Craig A
Bought by
Torres-Batista Cheryl and Batista Phillip J
Current Estimated Value
Home Financials for this Owner
Home Financials are based on the most recent Mortgage that was taken out on this home.
Original Mortgage
$222,144
Interest Rate
6.29%
Mortgage Type
Purchase Money Mortgage
Purchase Details
Closed on
Oct 15, 1998
Sold by
Desrosiers Yvonne B and Desrosiers Ronald J
Bought by
Souza Craig A and Souza Cherl
Purchase Details
Closed on
Jan 26, 1988
Sold by
Bourbeau Emile J
Bought by
Desrosiers Yvonne B
Create a Home Valuation Report for This Property
The Home Valuation Report is an in-depth analysis detailing your home's value as well as a comparison with similar homes in the area
Home Values in the Area
Average Home Value in this Area
Purchase History
| Date | Buyer | Sale Price | Title Company |
|---|---|---|---|
| Torres-Batista Cheryl | $224,900 | -- | |
| Souza Craig A | $98,500 | -- | |
| Desrosiers Yvonne B | $126,000 | -- |
Source: Public Records
Mortgage History
| Date | Status | Borrower | Loan Amount |
|---|---|---|---|
| Open | Desrosiers Yvonne B | $225,427 | |
| Closed | Desrosiers Yvonne B | $222,144 | |
| Previous Owner | Desrosiers Yvonne B | $148,970 |
Source: Public Records
Tax History Compared to Growth
Tax History
| Year | Tax Paid | Tax Assessment Tax Assessment Total Assessment is a certain percentage of the fair market value that is determined by local assessors to be the total taxable value of land and additions on the property. | Land | Improvement |
|---|---|---|---|---|
| 2025 | $36 | $330,300 | $90,600 | $239,700 |
| 2024 | $3,409 | $298,800 | $86,400 | $212,400 |
| 2023 | $3,361 | $280,100 | $78,000 | $202,100 |
| 2022 | $3,129 | $235,800 | $73,700 | $162,100 |
| 2021 | $2,565 | $222,700 | $73,700 | $149,000 |
| 2020 | $3,104 | $222,700 | $73,700 | $149,000 |
| 2019 | $2,370 | $206,300 | $65,300 | $141,000 |
| 2018 | $3,017 | $195,600 | $65,300 | $130,300 |
| 2017 | $2,250 | $188,300 | $65,300 | $123,000 |
| 2016 | $2,543 | $175,000 | $65,300 | $109,700 |
| 2015 | $2,499 | $175,000 | $65,300 | $109,700 |
Source: Public Records
Map
Nearby Homes