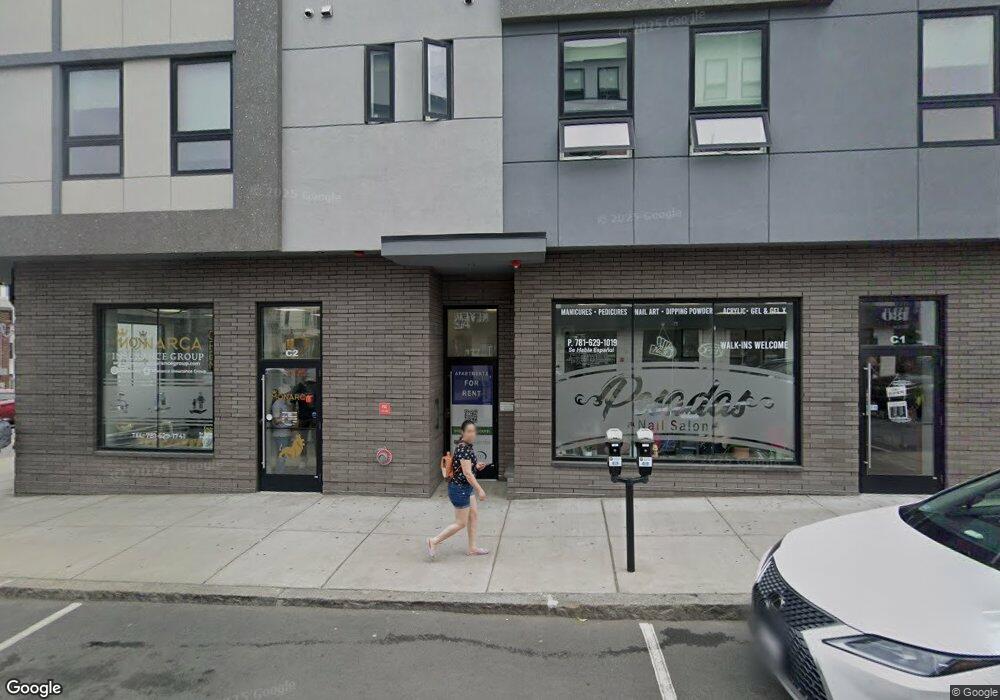
177 Shirley Ave Revere, MA 02151
Crescent Beach Neighborhood
--
Bed
18
Baths
333
Sq Ft
5,009
Sq Ft Lot
About This Home
Studio near Revere Beach MBTA train station (blue line) and the historic Revere Beach.
NO PARKING NO PETS
Recessed lighting - high ceilings - vinyl floors - great windows with tons of natural lighting - large walk-in closet
The kitchen - custom cabinets - granite counter tops - new stainless steel appliances.
The bathroom - new tile flooring - stand up tiled showers.
The unit is cable ready with a camera intercom system.
There is CSC mobile pay laundry on each floor.
This property is pet-free and smoke-free. Tenants pay for separately metered electric and the gas stove. **This is a commuter property. City of Revere will not issue a street street parking permit. Tenants residing on this property should not own a vehicle.**
Ownership History
Date
Name
Owned For
Owner Type
Purchase Details
Closed on
Dec 19, 2019
Sold by
Saint Jeans Cu
Bought by
Shirley North Llc
Home Financials for this Owner
Home Financials are based on the most recent Mortgage that was taken out on this home.
Original Mortgage
$1,200,000
Outstanding Balance
$1,053,402
Interest Rate
3.6%
Mortgage Type
Commercial
Create a Home Valuation Report for This Property
The Home Valuation Report is an in-depth analysis detailing your home's value as well as a comparison with similar homes in the area
Home Values in the Area
Average Home Value in this Area
Purchase History
| Date | Buyer | Sale Price | Title Company |
|---|---|---|---|
| Shirley North Llc | $200,000 | None Available | |
| Shirley North Llc | $200,000 | None Available | |
| Shirley North Llc | $200,000 | None Available |
Source: Public Records
Mortgage History
| Date | Status | Borrower | Loan Amount |
|---|---|---|---|
| Open | Shirley North Llc | $1,200,000 | |
| Closed | Shirley North Llc | $1,200,000 |
Source: Public Records
Property History
| Date | Event | Price | List to Sale | Price per Sq Ft |
|---|---|---|---|---|
| 10/01/2024 10/01/24 | For Rent | $1,850 | -- | -- |
Tax History Compared to Growth
Tax History
| Year | Tax Paid | Tax Assessment Tax Assessment Total Assessment is a certain percentage of the fair market value that is determined by local assessors to be the total taxable value of land and additions on the property. | Land | Improvement |
|---|---|---|---|---|
| 2025 | $0 | $3,468,400 | $1,240,000 | $2,228,400 |
| 2024 | $0 | $3,856,400 | $1,200,000 | $2,656,400 |
| 2023 | $0 | $3,371,800 | $1,000,000 | $2,371,800 |
| 2022 | $25,458 | $2,447,900 | $800,000 | $1,647,900 |
| 2021 | $7,396 | $668,700 | $165,800 | $502,900 |
| 2020 | $3,731 | $170,500 | $165,800 | $4,700 |
| 2019 | $3,644 | $153,900 | $149,200 | $4,700 |
| 2018 | $3,588 | $141,500 | $136,800 | $4,700 |
| 2017 | $3,565 | $129,500 | $124,400 | $5,100 |
| 2016 | $3,717 | $129,500 | $124,400 | $5,100 |
| 2015 | $3,851 | $129,500 | $124,400 | $5,100 |
Source: Public Records
Map
Nearby Homes
- 6 Garfield Ave
- 71 Revere Beach Blvd Unit 11
- 74 Garfield Ave
- 83 Shirley Ave
- 376 Ocean Ave Unit 706
- 376 Ocean Ave Unit 709
- 376 Ocean Ave Unit 1615
- 43 Kimball Ave Unit 2
- 37 Franklin Ave
- 10 Ocean Ave Unit 213
- 10 Ocean Ave Unit 203
- 10 Franklin Ave Unit 403
- 10 Franklin Ave Unit G10
- 10 Franklin Ave Unit 404
- 10 Franklin Ave Unit 402
- 10 Franklin Ave Unit 107
- 419 Lee Burbank Hwy
- 127 Atlantic Ave Unit 4
- 16 Wave Ave
- 15 Wave Ave Unit 2A
- 177 Shirley Ave Unit 204
- 177 Shirley Ave
- 177 Shirley Ave Unit 304
- 177 Shirley Ave Unit C2
- 177 Shirley Ave Unit 302
- 177 Shirley Ave Unit 402
- 177 Shirley Ave Unit 403
- 177 Shirley Ave Unit 401
- 177 Shirley Ave Unit C2
- 177 Shirley Ave Unit C1
- 1535 N Shore Rd
- 1535 N Shore Rd Unit 1
- 1535 N Shore Rd Unit 2
- 1535 N Shore Rd Unit 3
- 1535- 1539 N Shore Rd
- 173A Shirley Ave
- 173 Shirley Ave
- 173 Shirley Ave
- 1539 N Shore Rd
- 1539 N Shore Rd Unit 1