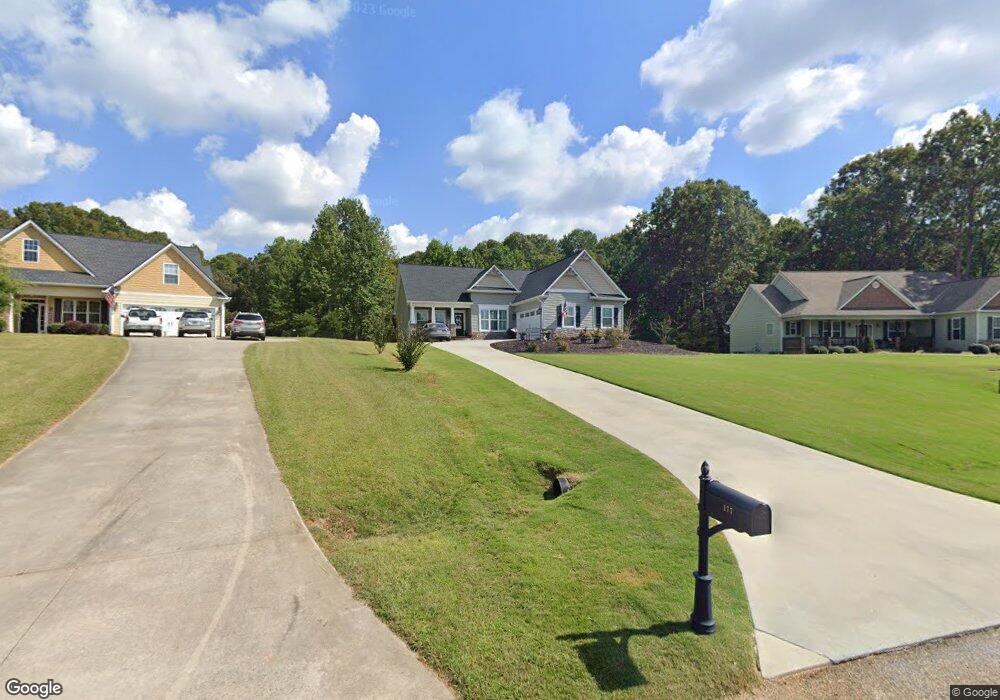
177 Sterling Hills Dr Unit 5 Clarkesville, GA 30523
Estimated Value: $386,000 - $521,000
5
Beds
2
Baths
1,920
Sq Ft
$226/Sq Ft
Est. Value
About This Home
This home is located at 177 Sterling Hills Dr Unit 5, Clarkesville, GA 30523 and is currently estimated at $433,166, approximately $225 per square foot. 177 Sterling Hills Dr Unit 5 is a home located in Habersham County with nearby schools including Fairview Elementary School, North Habersham Middle School, and Habersham Success Academy.
Ownership History
Date
Name
Owned For
Owner Type
Purchase Details
Closed on
Aug 18, 2020
Sold by
Benfiel Sam
Bought by
Wortham Carole Faye and Wortham James L
Current Estimated Value
Home Financials for this Owner
Home Financials are based on the most recent Mortgage that was taken out on this home.
Original Mortgage
$120,000
Outstanding Balance
$106,448
Interest Rate
3%
Mortgage Type
New Conventional
Estimated Equity
$326,718
Purchase Details
Closed on
Aug 16, 2019
Sold by
Gailey Thomas C
Bought by
Benfiel Sam
Purchase Details
Closed on
Feb 29, 2016
Sold by
Solid Rock Home Builders I
Bought by
Gailey Thomas C
Purchase Details
Closed on
Apr 2, 2015
Sold by
Solid Rock Home Builders I
Bought by
Solid Rock Home Builders Inc
Purchase Details
Closed on
Apr 1, 2006
Sold by
Not Provided
Bought by
Lacy Fred A
Purchase Details
Closed on
Dec 30, 2005
Sold by
Country South Builders Inc
Bought by
Hunter Jason M
Create a Home Valuation Report for This Property
The Home Valuation Report is an in-depth analysis detailing your home's value as well as a comparison with similar homes in the area
Home Values in the Area
Average Home Value in this Area
Purchase History
| Date | Buyer | Sale Price | Title Company |
|---|---|---|---|
| Wortham Carole Faye | $276,000 | -- | |
| Benfiel Sam | $18,500 | -- | |
| Gailey Thomas C | $24,000 | -- | |
| Solid Rock Home Builders Inc | $6,600 | -- | |
| Lacy Fred A | $43,000 | -- | |
| Hunter Jason M | $206,700 | -- |
Source: Public Records
Mortgage History
| Date | Status | Borrower | Loan Amount |
|---|---|---|---|
| Open | Wortham Carole Faye | $120,000 |
Source: Public Records
Tax History Compared to Growth
Tax History
| Year | Tax Paid | Tax Assessment Tax Assessment Total Assessment is a certain percentage of the fair market value that is determined by local assessors to be the total taxable value of land and additions on the property. | Land | Improvement |
|---|---|---|---|---|
| 2025 | $1,294 | $161,065 | $16,000 | $145,065 |
| 2024 | -- | $162,996 | $12,000 | $150,996 |
| 2023 | $1,127 | $136,388 | $12,000 | $124,388 |
| 2022 | $1,313 | $117,244 | $12,000 | $105,244 |
| 2021 | $1,077 | $104,468 | $12,000 | $92,468 |
| 2020 | $199 | $7,400 | $7,400 | $0 |
| 2019 | $269 | $10,000 | $10,000 | $0 |
| 2018 | $267 | $10,000 | $10,000 | $0 |
| 2017 | $258 | $9,600 | $9,600 | $0 |
| 2016 | $261 | $25,000 | $10,000 | $0 |
| 2015 | $258 | $25,000 | $10,000 | $0 |
| 2014 | $263 | $25,000 | $10,000 | $0 |
| 2013 | -- | $10,000 | $10,000 | $0 |
Source: Public Records
Map
Nearby Homes
- 255 Cool Springs Road Lot Rd Unit 7
- 255 Cool Springs Road -Lot #7 Rd
- 0 Harvest Church Rd
- 0 Harvest Church Rd Unit LOT 2 10606590
- 0 Harvest Church Rd Unit LOT 1 10606522
- 123 Grand Oaks Dr
- 230 Skyview Dr
- 239 Cool Springs Rd Unit LOT 8
- 303 Chitwood Rd
- 239 Cool Springs Lot #8 Rd
- 847 N Quail Trail
- 385 Amys Rd
- 147 Crest Winds Dr
- 474 White Pine Cir
- 1045 Fairview School Rd
- 350 Kitty Hawk Ln
- 271 Panacea Ln
- 355 Zeb Bryson Rd
- 132 Fairview Meadows Dr
- 22 Ridge Haven Dr
- 171 Sterling Hills Dr
- 171 Sterling Hills Dr Unit 4
- 165 Sterling Hills Dr
- 191 Sterling Hills Dr
- 153 Sterling Hills Dr Unit 2
- 153 Sterling Hills Dr
- 180 Sterling Hills Dr
- 0 Sterling Hills Dr Unit LOT 10 2968859
- 0 Sterling Hills Dr Unit LOT 10 7267855
- 10 Sterling Hils Dr
- 0 Sterling Hills Dr Unit 7254786
- 0 Sterling Hills Dr Unit 8380165
- 0 Sterling Hills Dr Unit 8549884
- 198 Sterling Hills Dr
- 125 Sterling Hills Dr Unit 1
- 125 Sterling Hills Dr
- 428 Southern Estates Dr
- LOT 21 Southern Estates Dr
- LOT 17 Southern Estates Dr
- LOT 1 Southern Estates Dr