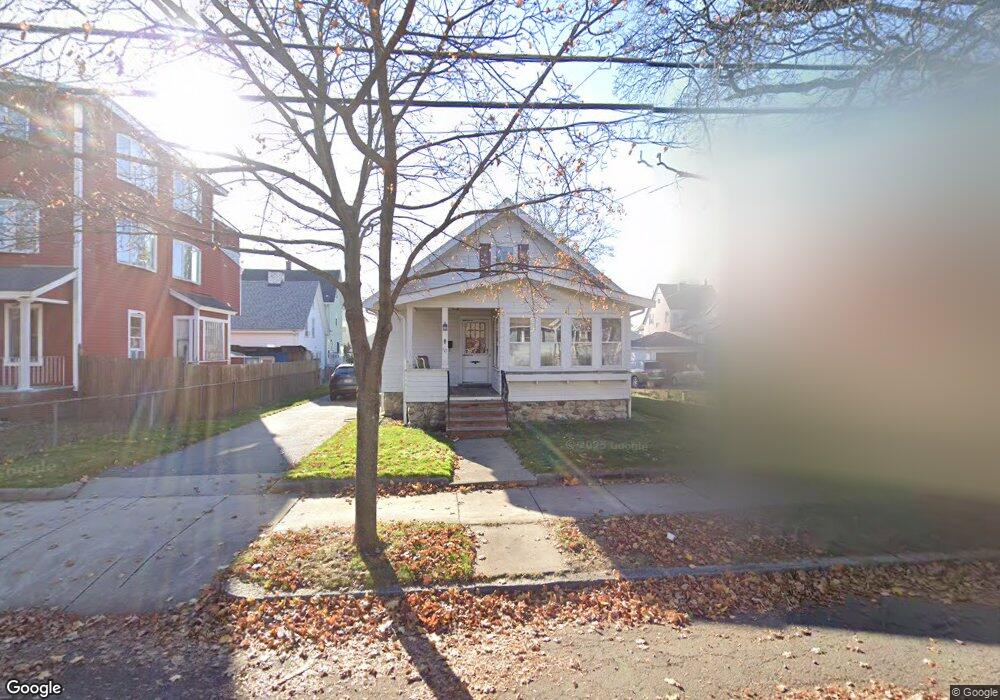
177 Webster St Malden, MA 02148
Maplewood NeighborhoodEstimated Value: $618,719 - $699,000
2
Beds
2
Baths
1,194
Sq Ft
$558/Sq Ft
Est. Value
About This Home
This home is located at 177 Webster St, Malden, MA 02148 and is currently estimated at $666,680, approximately $558 per square foot. 177 Webster St is a home located in Middlesex County with nearby schools including Malden High School and Malden Catholic.
Ownership History
Date
Name
Owned For
Owner Type
Purchase Details
Closed on
Jun 15, 2007
Sold by
Fazio Diane
Bought by
Maccario John J
Current Estimated Value
Home Financials for this Owner
Home Financials are based on the most recent Mortgage that was taken out on this home.
Original Mortgage
$265,000
Outstanding Balance
$162,152
Interest Rate
6.19%
Mortgage Type
Purchase Money Mortgage
Estimated Equity
$504,528
Create a Home Valuation Report for This Property
The Home Valuation Report is an in-depth analysis detailing your home's value as well as a comparison with similar homes in the area
Home Values in the Area
Average Home Value in this Area
Purchase History
| Date | Buyer | Sale Price | Title Company |
|---|---|---|---|
| Maccario John J | $330,000 | -- |
Source: Public Records
Mortgage History
| Date | Status | Borrower | Loan Amount |
|---|---|---|---|
| Open | Maccario John J | $265,000 |
Source: Public Records
Tax History
| Year | Tax Paid | Tax Assessment Tax Assessment Total Assessment is a certain percentage of the fair market value that is determined by local assessors to be the total taxable value of land and additions on the property. | Land | Improvement |
|---|---|---|---|---|
| 2025 | $64 | $563,800 | $335,300 | $228,500 |
| 2024 | $6,138 | $525,100 | $317,200 | $207,900 |
| 2023 | $5,868 | $481,400 | $290,000 | $191,400 |
| 2022 | $5,546 | $449,100 | $262,800 | $186,300 |
| 2021 | $5,209 | $423,800 | $240,100 | $183,700 |
| 2020 | $5,179 | $409,400 | $228,400 | $181,000 |
| 2019 | $5,169 | $389,500 | $217,500 | $172,000 |
| 2018 | $4,919 | $349,100 | $183,500 | $165,600 |
| 2017 | $4,710 | $332,400 | $183,500 | $148,900 |
| 2016 | $4,668 | $307,900 | $174,400 | $133,500 |
| 2015 | $4,546 | $289,000 | $164,500 | $124,500 |
| 2014 | $4,268 | $265,100 | $149,500 | $115,600 |
Source: Public Records
Map
Nearby Homes
- 101 Waite St Unit B5
- 44-46 Myrtle St
- 42-44 Columbia St
- 557 Salem St Unit 3
- 557 Salem St Unit 4
- 55 Bowman St
- 11 Havelock St
- 31 Preston St
- 48 Summit St
- 10 Dell St
- 39 Broadway Unit 305
- 70-72 Bainbridge St
- 1135 Salem St
- 16 Willard St
- 43 Granville Ave
- 112 Hadley St
- 32 Beach St
- 102 Suffolk St
- 5 Mason St
- 65 Central Ave
Your Personal Tour Guide
Ask me questions while you tour the home.