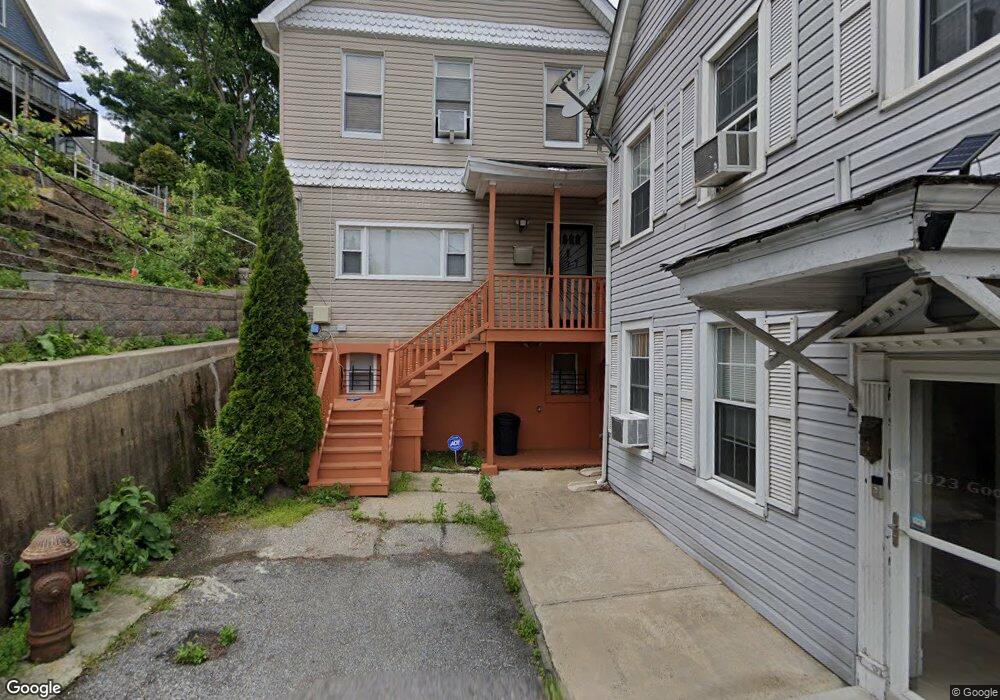
177 Wright St Staten Island, NY 10304
Stapleton NeighborhoodEstimated Value: $461,000 - $580,000
3
Beds
1
Bath
1,056
Sq Ft
$485/Sq Ft
Est. Value
About This Home
This home is located at 177 Wright St, Staten Island, NY 10304 and is currently estimated at $512,089, approximately $484 per square foot. 177 Wright St is a home located in Richmond County with nearby schools including P.S. 16 John J Driscoll, P.S. 74 Future Leaders Elementary School, and Fort Hill Collaborative Elementary.
Ownership History
Date
Name
Owned For
Owner Type
Purchase Details
Closed on
Apr 1, 2005
Sold by
Our Home Ltd
Bought by
Dixon John
Current Estimated Value
Home Financials for this Owner
Home Financials are based on the most recent Mortgage that was taken out on this home.
Original Mortgage
$305,900
Interest Rate
5.62%
Mortgage Type
Fannie Mae Freddie Mac
Purchase Details
Closed on
Oct 15, 2004
Sold by
Countrywide Home Loans Inc
Bought by
Our Home Ltd
Purchase Details
Closed on
Feb 19, 2004
Sold by
Va
Bought by
Countrywide Home Loans Inc
Create a Home Valuation Report for This Property
The Home Valuation Report is an in-depth analysis detailing your home's value as well as a comparison with similar homes in the area
Home Values in the Area
Average Home Value in this Area
Purchase History
| Date | Buyer | Sale Price | Title Company |
|---|---|---|---|
| Dixon John | $339,900 | Fidelity National Title Insu | |
| Our Home Ltd | $155,000 | -- | |
| Countrywide Home Loans Inc | -- | -- |
Source: Public Records
Mortgage History
| Date | Status | Borrower | Loan Amount |
|---|---|---|---|
| Previous Owner | Dixon John | $305,900 |
Source: Public Records
Tax History
| Year | Tax Paid | Tax Assessment Tax Assessment Total Assessment is a certain percentage of the fair market value that is determined by local assessors to be the total taxable value of land and additions on the property. | Land | Improvement |
|---|---|---|---|---|
| 2025 | $3,877 | $28,080 | $4,617 | $23,463 |
| 2024 | $3,889 | $25,560 | $5,005 | $20,555 |
| 2023 | $3,696 | $19,598 | $4,013 | $15,585 |
| 2022 | $3,404 | $25,080 | $6,180 | $18,900 |
| 2021 | $3,588 | $20,760 | $6,180 | $14,580 |
| 2020 | $3,405 | $21,180 | $6,180 | $15,000 |
| 2019 | $3,316 | $22,980 | $6,180 | $16,800 |
| 2018 | $3,032 | $16,332 | $3,849 | $12,483 |
| 2017 | $2,841 | $15,409 | $4,975 | $10,434 |
| 2016 | $2,771 | $15,409 | $4,738 | $10,671 |
| 2015 | $2,454 | $14,569 | $4,782 | $9,787 |
| 2014 | $2,454 | $14,376 | $4,719 | $9,657 |
Source: Public Records
Map
Nearby Homes
- 175 Wright St
- 160 Beach St
- 173 Wright St
- 156 Beach St
- 174 Wright St Unit LL
- 174 Wright St
- 168 Beach St
- 168 Beach St Unit 2
- 171 Wright St
- 152 Beach St
- 162 Beach St
- 176 Wright St
- 172 Wright St
- 150 Beach St
- 170 Wright St
- 169 Wright St
- 168 Wright St
- 165 Wright St
- 165 Wright St Unit Building
- 148 Beach St
Your Personal Tour Guide
Ask me questions while you tour the home.