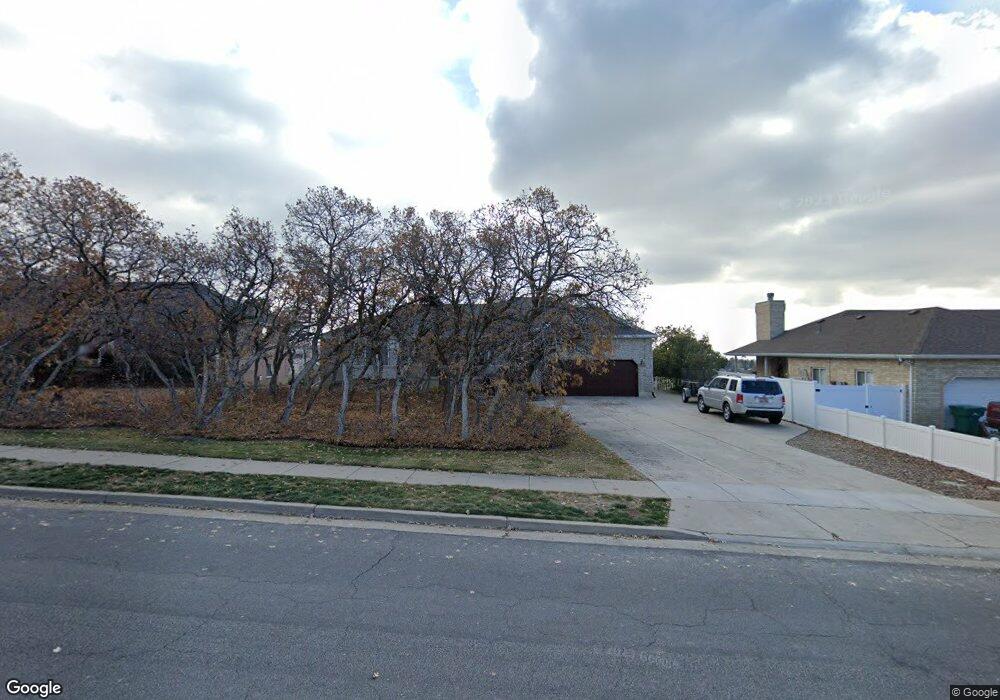
1770 E Beechwood Dr Layton, UT 84040
Estimated Value: $651,000 - $718,324
6
Beds
4
Baths
3,660
Sq Ft
$189/Sq Ft
Est. Value
About This Home
This home is located at 1770 E Beechwood Dr, Layton, UT 84040 and is currently estimated at $692,831, approximately $189 per square foot. 1770 E Beechwood Dr is a home located in Davis County with nearby schools including Sarah Jane Adams Elementary School, North Layton Junior High School, and Northridge High School.
Ownership History
Date
Name
Owned For
Owner Type
Purchase Details
Closed on
Aug 1, 2013
Sold by
Bowman Steven and Bowman Stacey
Bought by
Longshore David C and Beck Kimberly E
Current Estimated Value
Purchase Details
Closed on
Mar 11, 2002
Sold by
Bowman Steven
Bought by
Bowman Steven and Bowman Stacey
Home Financials for this Owner
Home Financials are based on the most recent Mortgage that was taken out on this home.
Original Mortgage
$230,250
Interest Rate
6.99%
Purchase Details
Closed on
Aug 10, 1998
Sold by
Smith Paul D and Smith Verlene May
Bought by
Bowman Steven
Home Financials for this Owner
Home Financials are based on the most recent Mortgage that was taken out on this home.
Original Mortgage
$220,500
Interest Rate
6.88%
Create a Home Valuation Report for This Property
The Home Valuation Report is an in-depth analysis detailing your home's value as well as a comparison with similar homes in the area
Home Values in the Area
Average Home Value in this Area
Purchase History
| Date | Buyer | Sale Price | Title Company |
|---|---|---|---|
| Longshore David C | -- | Backman Title Services Ltd | |
| Bowman Steven | -- | Founders Title Co | |
| Bowman Steven | -- | U S Title |
Source: Public Records
Mortgage History
| Date | Status | Borrower | Loan Amount |
|---|---|---|---|
| Previous Owner | Bowman Steven | $230,250 | |
| Previous Owner | Bowman Steven | $220,500 |
Source: Public Records
Tax History
| Year | Tax Paid | Tax Assessment Tax Assessment Total Assessment is a certain percentage of the fair market value that is determined by local assessors to be the total taxable value of land and additions on the property. | Land | Improvement |
|---|---|---|---|---|
| 2025 | $3,676 | $354,200 | $181,568 | $172,632 |
| 2024 | $3,596 | $352,550 | $198,436 | $154,114 |
| 2023 | $3,567 | $623,000 | $250,213 | $372,787 |
| 2022 | $3,629 | $345,950 | $135,696 | $210,254 |
| 2021 | $3,366 | $478,000 | $208,913 | $269,087 |
| 2020 | $3,069 | $417,000 | $179,003 | $237,997 |
| 2019 | $2,955 | $395,000 | $157,733 | $237,267 |
| 2018 | $2,729 | $366,000 | $130,784 | $235,216 |
| 2016 | $2,529 | $178,090 | $67,135 | $110,955 |
| 2015 | $2,554 | $172,095 | $67,135 | $104,960 |
| 2014 | $2,754 | $191,473 | $67,135 | $124,338 |
| 2013 | -- | $141,378 | $64,121 | $77,257 |
Source: Public Records
Map
Nearby Homes
- 1540 E Primrose Ln
- 1465 E Sego Lily Ct
- 1476 Kays Creek Dr
- 2096 N 1450 E
- 1843 Hayes Dr
- 2189 N 1950 E
- 1350 Kays Creek Dr
- 1354 E Hollyhock Way
- 1305 E Larkspur Way
- 1340 E Hollyhock Way
- 1266 E Larkspur Way
- 2273 N 1975 E
- 1444 E 2400 N
- 1099 E 2125 N
- 1960 N 2150 E
- 1120 E 2200 N
- 3142 E Thorley Dr
- 3138 E Thorley Dr
- 2340 N 2050 E
- 1975 E 1425 N
- 1780 E Beechwood Dr
- 1758 E Beechwood Dr
- 1748 E Beechwood Dr
- 1790 E Beechwood Dr
- 1748 E 1950 N
- 1767 E 1950 N
- 1767 E Beechwood Dr
- 1777 E Beechwood Dr
- 1740 E Beechwood Dr
- 1802 E Beechwood Dr
- 1759 E Beechwood Dr
- 1985 N 1800 E
- 1747 E Beechwood Dr
- 1712 E Beechwood Dr
- 1808 E 1950 N
- 1808 E Beechwood Dr
- 1743 E Beechwood Dr
- 1805 E Beechwood Dr
- 1715 E Beechwood Dr
- 1715 E Beechwood Dr Unit 501
Your Personal Tour Guide
Ask me questions while you tour the home.