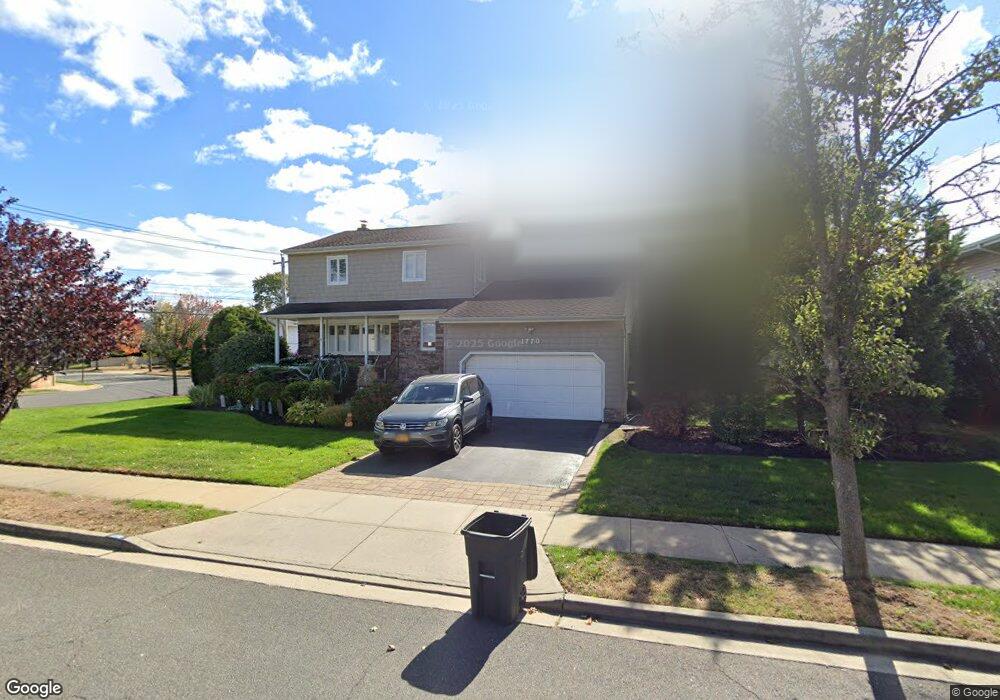
1770 John St Merrick, NY 11566
Estimated Value: $809,350 - $898,000
Studio
3
Baths
1,870
Sq Ft
$457/Sq Ft
Est. Value
About This Home
This home is located at 1770 John St, Merrick, NY 11566 and is currently estimated at $853,675, approximately $456 per square foot. 1770 John St is a home located in Nassau County with nearby schools including Merrick Avenue Middle School, John F. Kennedy High School, and Grace Christian Academy.
Ownership History
Date
Name
Owned For
Owner Type
Purchase Details
Closed on
Oct 20, 2020
Sold by
Strober Leonard and Strober Gertrude Lanigan
Bought by
Strober Kyle and Strober Elyse
Current Estimated Value
Home Financials for this Owner
Home Financials are based on the most recent Mortgage that was taken out on this home.
Original Mortgage
$300,000
Outstanding Balance
$266,348
Interest Rate
2.8%
Mortgage Type
New Conventional
Estimated Equity
$587,327
Create a Home Valuation Report for This Property
The Home Valuation Report is an in-depth analysis detailing your home's value as well as a comparison with similar homes in the area
Home Values in the Area
Average Home Value in this Area
Purchase History
| Date | Buyer | Sale Price | Title Company |
|---|---|---|---|
| Strober Kyle | $600,000 | Commonwealth Land Title |
Source: Public Records
Mortgage History
| Date | Status | Borrower | Loan Amount |
|---|---|---|---|
| Open | Strober Kyle | $300,000 |
Source: Public Records
Tax History
| Year | Tax Paid | Tax Assessment Tax Assessment Total Assessment is a certain percentage of the fair market value that is determined by local assessors to be the total taxable value of land and additions on the property. | Land | Improvement |
|---|---|---|---|---|
| 2025 | $17,667 | $582 | $253 | $329 |
| 2024 | $4,204 | $607 | $263 | $344 |
Source: Public Records
Map
Nearby Homes
- 1749 Ann Rd
- 2988 Bond Dr
- 2994 Lonni Ln
- 2848 Clubhouse Rd
- 3034 Bond Dr
- 1993 Lowell Ln
- 3106 Clubhouse Rd
- 2704 Beach Dr
- 2998 Joyce Ln
- 1903 George Ct
- 2688 Rosebud Ave
- 48 Rosebud Ave
- 2729 Shore Dr
- 60 Montauk Ave
- 2863 Harbor Rd
- 2819 Harbor Rd
- 2884 Bay Dr
- 1945 Byron Rd
- 212 Babylon Turnpike
- 2845 Whaleneck Dr