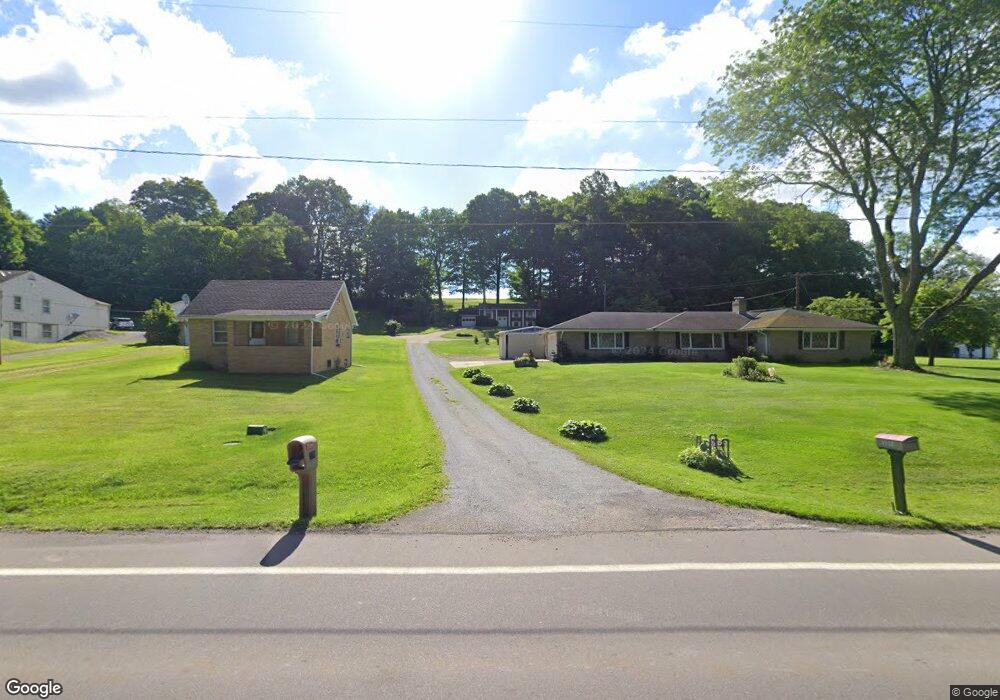
1770 Union Ave SE Minerva, OH 44657
Estimated Value: $172,000 - $255,000
3
Beds
2
Baths
1,040
Sq Ft
$208/Sq Ft
Est. Value
About This Home
This home is located at 1770 Union Ave SE, Minerva, OH 44657 and is currently estimated at $215,807, approximately $207 per square foot. 1770 Union Ave SE is a home located in Stark County with nearby schools including Minerva Elementary School, Minerva Middle School, and Minerva High School.
Ownership History
Date
Name
Owned For
Owner Type
Purchase Details
Closed on
Nov 30, 2021
Sold by
Louive Janice M
Bought by
Lab Brian Anthony and Lab Joelle Lynn
Current Estimated Value
Home Financials for this Owner
Home Financials are based on the most recent Mortgage that was taken out on this home.
Original Mortgage
$186,558
Outstanding Balance
$171,538
Interest Rate
3.09%
Mortgage Type
FHA
Estimated Equity
$44,269
Purchase Details
Closed on
May 11, 1995
Sold by
Brewster Francis
Bought by
Louive Frank T and Louive Janice M
Home Financials for this Owner
Home Financials are based on the most recent Mortgage that was taken out on this home.
Original Mortgage
$76,950
Interest Rate
8.39%
Mortgage Type
New Conventional
Purchase Details
Closed on
Mar 3, 1992
Create a Home Valuation Report for This Property
The Home Valuation Report is an in-depth analysis detailing your home's value as well as a comparison with similar homes in the area
Home Values in the Area
Average Home Value in this Area
Purchase History
| Date | Buyer | Sale Price | Title Company |
|---|---|---|---|
| Lab Brian Anthony | $190,000 | Clear Title Solutions Inc | |
| Louive Frank T | $85,500 | -- | |
| -- | $79,500 | -- |
Source: Public Records
Mortgage History
| Date | Status | Borrower | Loan Amount |
|---|---|---|---|
| Open | Lab Brian Anthony | $186,558 | |
| Previous Owner | Louive Frank T | $76,950 |
Source: Public Records
Tax History Compared to Growth
Tax History
| Year | Tax Paid | Tax Assessment Tax Assessment Total Assessment is a certain percentage of the fair market value that is determined by local assessors to be the total taxable value of land and additions on the property. | Land | Improvement |
|---|---|---|---|---|
| 2025 | -- | $54,750 | $6,480 | $48,270 |
| 2024 | -- | $54,750 | $6,480 | $48,270 |
| 2023 | $2,013 | $46,800 | $5,600 | $41,200 |
| 2022 | $2,027 | $46,800 | $5,600 | $41,200 |
| 2021 | $1,686 | $46,800 | $5,600 | $41,200 |
| 2020 | $1,548 | $41,300 | $4,970 | $36,330 |
| 2019 | $1,273 | $41,320 | $4,970 | $36,350 |
| 2018 | $1,397 | $41,320 | $4,970 | $36,350 |
| 2017 | $1,257 | $36,870 | $4,730 | $32,140 |
| 2016 | $1,195 | $35,370 | $4,730 | $30,640 |
| 2015 | $1,206 | $35,370 | $4,730 | $30,640 |
| 2014 | $1,019 | $29,830 | $3,990 | $25,840 |
| 2013 | $516 | $29,830 | $3,990 | $25,840 |
Source: Public Records
Map
Nearby Homes
- 2126 Union Ave NE
- 15961 Terramont St NE
- 10514 Harry June Cir
- 22141 Mcdaniel St
- 208 Ridgewood Blvd
- 710 E Lincolnway
- 22762 Mountz Rd
- 14015 Stimmel St NE
- 817 Hillview Ave
- 15561 Georgetown St NE
- 0 Lynnwood Dr
- 0 Lincoln St SE
- 0 Sr 30 Hwy
- 0 Lisbon St NE
- 401 Prospect St
- 102 Murray Ave Unit 10A
- 106 N Hilltop Dr
- 110 S Liberty St Unit 10
- 0 Stonehedge Dr
- 518 King St
- 1778 Union Ave SE
- 1750 Union Ave SE
- 1734 Union Ave SE
- 1792 Union Ave SE
- 1656 Union Ave SE
- 1656 Union Ave SE Unit 2
- 1820 Union Ave SE
- 1737 Union Ave SE
- 1765 Union Ave SE
- 1791 Union Ave SE
- 1805 Union Ave SE
- 1695 Union Ave SE
- 0 Freed St SE
- 1860 Union Ave SE
- 1663 Union Ave SE
- 1851 Union Ave SE
- 1874 Union Ave SE
- 1635 Union Ave SE
- 1628 Union Ave SE
- 1896 Union Ave SE