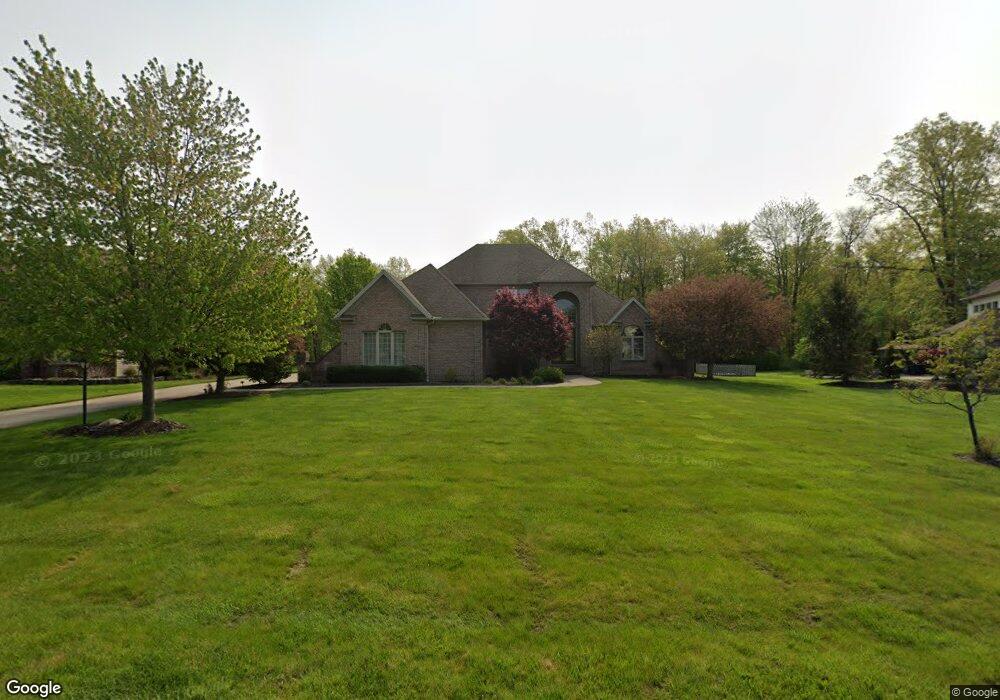
1770 Windsor Trace NE Warren, OH 44484
Estimated Value: $527,686 - $608,000
3
Beds
3
Baths
3,162
Sq Ft
$180/Sq Ft
Est. Value
About This Home
This home is located at 1770 Windsor Trace NE, Warren, OH 44484 and is currently estimated at $567,672, approximately $179 per square foot. 1770 Windsor Trace NE is a home located in Trumbull County with nearby schools including Howland High School.
Ownership History
Date
Name
Owned For
Owner Type
Purchase Details
Closed on
Feb 16, 2024
Sold by
Kap Leasing Ltd
Bought by
Ray Shawn Jeffrey and Novotny Sharrie Eileen
Current Estimated Value
Home Financials for this Owner
Home Financials are based on the most recent Mortgage that was taken out on this home.
Original Mortgage
$430,066
Outstanding Balance
$423,164
Interest Rate
7.12%
Mortgage Type
FHA
Estimated Equity
$144,508
Purchase Details
Closed on
Sep 29, 2021
Sold by
Clemente Patrick T and Clemente Julia
Bought by
Kap Leasing Ltd
Purchase Details
Closed on
Aug 16, 2017
Sold by
Hunter Design& Construction Inc
Bought by
Clemente Patrick T
Purchase Details
Closed on
Jan 13, 2009
Sold by
Harman Paul W and Harman Linda J
Bought by
Clemente Patrick T
Home Financials for this Owner
Home Financials are based on the most recent Mortgage that was taken out on this home.
Original Mortgage
$232,000
Interest Rate
5.19%
Mortgage Type
Purchase Money Mortgage
Create a Home Valuation Report for This Property
The Home Valuation Report is an in-depth analysis detailing your home's value as well as a comparison with similar homes in the area
Home Values in the Area
Average Home Value in this Area
Purchase History
| Date | Buyer | Sale Price | Title Company |
|---|---|---|---|
| Ray Shawn Jeffrey | $438,000 | None Listed On Document | |
| Kap Leasing Ltd | $360,000 | None Available | |
| Clemente Patrick T | -- | None Available | |
| Clemente Patrick T | $352,000 | Attorney |
Source: Public Records
Mortgage History
| Date | Status | Borrower | Loan Amount |
|---|---|---|---|
| Open | Ray Shawn Jeffrey | $430,066 | |
| Previous Owner | Clemente Patrick T | $232,000 |
Source: Public Records
Tax History Compared to Growth
Tax History
| Year | Tax Paid | Tax Assessment Tax Assessment Total Assessment is a certain percentage of the fair market value that is determined by local assessors to be the total taxable value of land and additions on the property. | Land | Improvement |
|---|---|---|---|---|
| 2024 | $9,237 | $170,520 | $25,060 | $145,460 |
| 2023 | $9,237 | $170,520 | $25,060 | $145,460 |
| 2022 | $7,789 | $121,070 | $25,060 | $96,010 |
| 2021 | $7,433 | $121,070 | $25,060 | $96,010 |
| 2020 | $7,462 | $121,070 | $25,060 | $96,010 |
| 2019 | $7,526 | $115,640 | $25,060 | $90,580 |
| 2018 | $0 | $0 | $0 | $0 |
| 2017 | $6,366 | $113,720 | $23,140 | $90,580 |
| 2016 | $6,018 | $104,480 | $23,100 | $81,380 |
| 2015 | $5,868 | $104,480 | $23,100 | $81,380 |
| 2014 | $5,664 | $104,480 | $23,100 | $81,380 |
| 2013 | $5,629 | $104,480 | $23,100 | $81,380 |
Source: Public Records
Map
Nearby Homes
- 1015 Cambridge Ct NE
- 2158 Celestial Dr NE
- 2212 Celestial Dr NE
- 2329 Henn Hyde Rd NE
- 9550 Hunt Club Trail NE
- 2140 Howland Wilson Rd NE
- 2193 Howland Wilson Rd NE
- 1750 Portal Dr NE
- 0 Palette Dr NE Unit 5010848
- 1283 Henn Hyde Rd NE
- 5 Oh-46
- 4 Niles Cortland Rd NE
- 0 #3 Niles Cortland Rd- Sr 46 Unit 4274646
- 1 Oh-46
- 0 Niles Cortland Rd Sr 46 Unit 4273262
- 0 Muir Woods Dr
- 8936 Stetson Dr NE
- 8848 King Graves Rd NE
- Lot 4 N Gulch Ln
- 2133 Silver Fox Ln NE
- 1750 Windsor Trace NE
- 1760 Windsor Trace NE
- 9365 Hunt Club Trail NE
- 1650 Windsor Trace NE
- 1775 Windsor Trace NE
- 1755 Windsor Trace NE
- 9395 Hunt Club Trail NE
- 1735 Windsor Trace NE
- 9355 Hunt Club Trail NE
- 9380 Hunt Club Trail NE
- 1640 Windsor Trace NE
- 9405 Hunt Club Trail NE
- 1715 Windsor Trace NE
- 9360 Hunt Club Trail NE
- 1775 Brittainy Oaks Trail NE
- 1795 Brittainy Oaks Trail NE
- 1755 Brittainy Oaks Trail NE
- 1825 Brittainy Oaks Trail NE
- 9350 Hunt Club Trail NE
- 1655 Windsor Trace NE