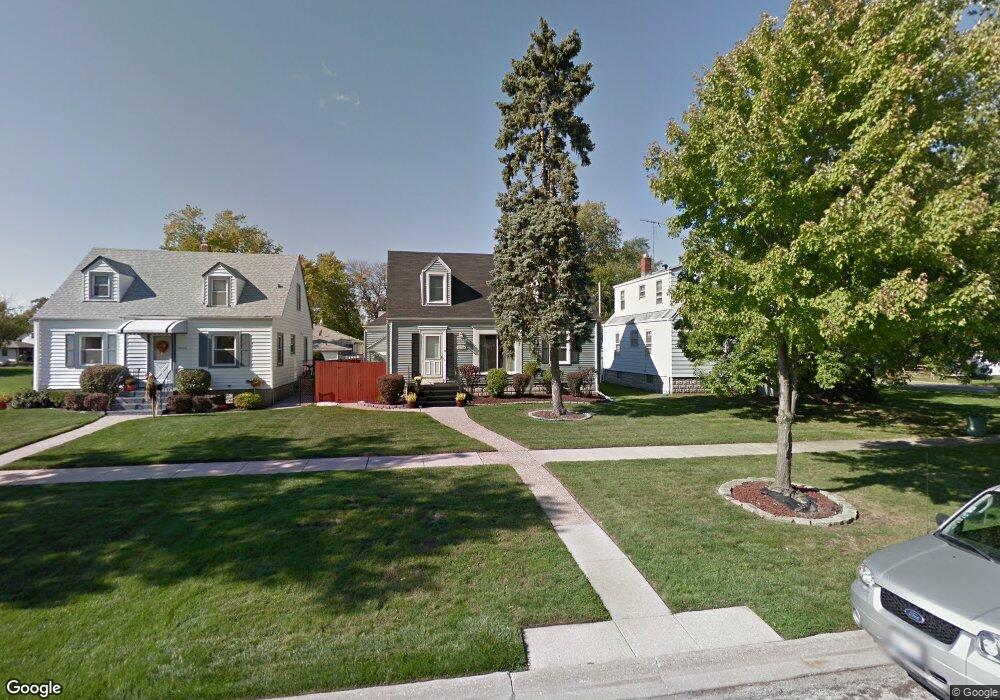
17706 State Line Ave Lansing, IL 60438
Estimated Value: $158,777 - $183,000
3
Beds
2
Baths
816
Sq Ft
$209/Sq Ft
Est. Value
About This Home
This home is located at 17706 State Line Ave, Lansing, IL 60438 and is currently estimated at $170,944, approximately $209 per square foot. 17706 State Line Ave is a home located in Cook County with nearby schools including Coolidge Elementary School, Memorial Jr High School, and Thornton Fractnl So High School.
Ownership History
Date
Name
Owned For
Owner Type
Purchase Details
Closed on
Jun 24, 2013
Sold by
Three Pals Property Management Inc
Bought by
Thompson Carmen M
Current Estimated Value
Home Financials for this Owner
Home Financials are based on the most recent Mortgage that was taken out on this home.
Original Mortgage
$102,999
Outstanding Balance
$73,300
Interest Rate
3.5%
Mortgage Type
FHA
Estimated Equity
$97,644
Purchase Details
Closed on
Oct 11, 2011
Sold by
Montpetit
Bought by
Federal National Mortgage Association
Purchase Details
Closed on
Aug 11, 2006
Sold by
Hill Eugene G and Hill Kimberly A
Bought by
Montpetit Deborah A
Home Financials for this Owner
Home Financials are based on the most recent Mortgage that was taken out on this home.
Original Mortgage
$139,000
Interest Rate
6.78%
Mortgage Type
Unknown
Create a Home Valuation Report for This Property
The Home Valuation Report is an in-depth analysis detailing your home's value as well as a comparison with similar homes in the area
Home Values in the Area
Average Home Value in this Area
Purchase History
| Date | Buyer | Sale Price | Title Company |
|---|---|---|---|
| Thompson Carmen M | $105,000 | Fidelity National Title | |
| Federal National Mortgage Association | -- | None Available | |
| Montpetit Deborah A | $139,000 | Pntn |
Source: Public Records
Mortgage History
| Date | Status | Borrower | Loan Amount |
|---|---|---|---|
| Open | Thompson Carmen M | $102,999 | |
| Previous Owner | Montpetit Deborah A | $139,000 |
Source: Public Records
Tax History Compared to Growth
Tax History
| Year | Tax Paid | Tax Assessment Tax Assessment Total Assessment is a certain percentage of the fair market value that is determined by local assessors to be the total taxable value of land and additions on the property. | Land | Improvement |
|---|---|---|---|---|
| 2024 | $2,274 | $6,358 | $1,485 | $4,873 |
| 2023 | $2,127 | $6,358 | $1,485 | $4,873 |
| 2022 | $2,127 | $4,986 | $1,283 | $3,703 |
| 2021 | $2,097 | $4,983 | $1,282 | $3,701 |
| 2020 | $2,013 | $4,983 | $1,282 | $3,701 |
| 2019 | $1,908 | $5,067 | $1,080 | $3,987 |
| 2018 | $1,872 | $5,067 | $1,080 | $3,987 |
| 2017 | $1,907 | $5,067 | $1,080 | $3,987 |
| 2016 | $1,352 | $3,721 | $1,012 | $2,709 |
| 2015 | $1,224 | $3,721 | $1,012 | $2,709 |
| 2014 | $1,221 | $3,721 | $1,012 | $2,709 |
| 2013 | $1,820 | $5,357 | $1,012 | $4,345 |
Source: Public Records
Map
Nearby Homes
- 7624 Forest Ave
- 17517 Shirley Dr
- 17706 Wentworth Ave
- 17511 Maple Ave
- 17611 Bernadine St
- 108 Beverly Place
- 17922 State Line Ave
- 237 Hollywood Ave
- 17702 Bernadine St
- 248 Adelaide Place
- 17945 Maple St
- 7937 Forest Ave
- 7405 Meadow Lane Ave
- 8019 Hohman Ave
- 3423 Adams St
- 7905 Frederick Ave
- 3540 Bernice Rd
- 3336 178th St
- 17603 Community St
- 220 173rd St
- 17706 State Line Ave
- 17710 State Line Ave
- 17710 State Line Ave
- 17704 State Line Ave
- 17704 State Line Ave
- 17704 State Line Ave
- 17711 Maple St
- 17707 Maple St
- 17701 Maple St
- 17715 Maple St
- 17656 State Line Ave
- 7731 State Line Ave
- 7709 State Line Ave
- 7705 State Line Ave
- 17657 Maple St
- 7715 State Line Ave
- 17652 State Line Ave
- 17652 State Line Ave
- 17653 Maple St
- 7719 State Line Ave