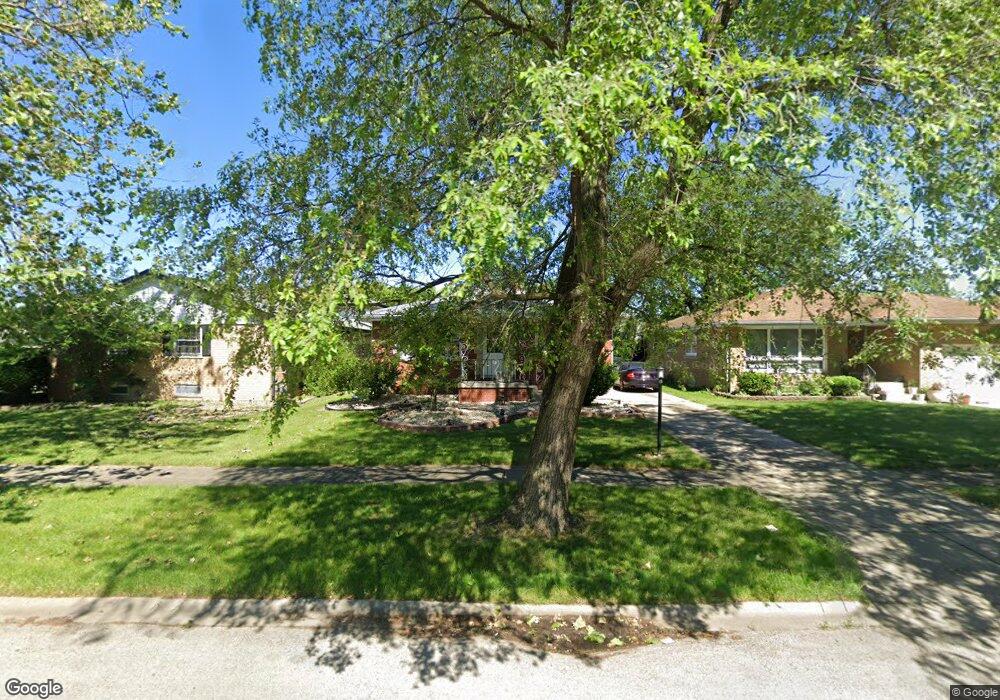
17707 Bernadine St Lansing, IL 60438
Estimated Value: $199,000 - $225,000
3
Beds
2
Baths
1,395
Sq Ft
$153/Sq Ft
Est. Value
About This Home
This home is located at 17707 Bernadine St, Lansing, IL 60438 and is currently estimated at $212,933, approximately $152 per square foot. 17707 Bernadine St is a home located in Cook County with nearby schools including Coolidge Elementary School, Memorial Jr High School, and Thornton Fractnl So High School.
Ownership History
Date
Name
Owned For
Owner Type
Purchase Details
Closed on
Nov 15, 2007
Sold by
Rogers Cynthia C
Bought by
Johnson Dorian A
Current Estimated Value
Home Financials for this Owner
Home Financials are based on the most recent Mortgage that was taken out on this home.
Original Mortgage
$163,000
Outstanding Balance
$102,865
Interest Rate
6.33%
Mortgage Type
Unknown
Estimated Equity
$110,068
Purchase Details
Closed on
Sep 1, 2004
Sold by
Rogers Brian and Rogers Karen
Bought by
Rogers Cynthia C
Purchase Details
Closed on
Jan 15, 1997
Sold by
Rogers Alvinl and Rogers Amelia B
Bought by
Rogers Bran and Rogers Karen
Home Financials for this Owner
Home Financials are based on the most recent Mortgage that was taken out on this home.
Original Mortgage
$93,750
Interest Rate
5.9%
Create a Home Valuation Report for This Property
The Home Valuation Report is an in-depth analysis detailing your home's value as well as a comparison with similar homes in the area
Home Values in the Area
Average Home Value in this Area
Purchase History
| Date | Buyer | Sale Price | Title Company |
|---|---|---|---|
| Johnson Dorian A | $163,000 | Pntn | |
| Rogers Cynthia C | -- | -- | |
| Rogers Bran | $125,000 | -- |
Source: Public Records
Mortgage History
| Date | Status | Borrower | Loan Amount |
|---|---|---|---|
| Open | Johnson Dorian A | $163,000 | |
| Previous Owner | Rogers Bran | $93,750 |
Source: Public Records
Tax History Compared to Growth
Tax History
| Year | Tax Paid | Tax Assessment Tax Assessment Total Assessment is a certain percentage of the fair market value that is determined by local assessors to be the total taxable value of land and additions on the property. | Land | Improvement |
|---|---|---|---|---|
| 2024 | $5,605 | $14,900 | $2,805 | $12,095 |
| 2023 | $4,313 | $14,900 | $2,805 | $12,095 |
| 2022 | $4,313 | $10,057 | $2,475 | $7,582 |
| 2021 | $4,252 | $10,057 | $2,475 | $7,582 |
| 2020 | $4,080 | $10,057 | $2,475 | $7,582 |
| 2019 | $4,101 | $10,633 | $2,310 | $8,323 |
| 2018 | $4,022 | $10,633 | $2,310 | $8,323 |
| 2017 | $4,095 | $10,633 | $2,310 | $8,323 |
| 2016 | $4,381 | $10,510 | $2,145 | $8,365 |
| 2015 | $4,007 | $10,510 | $2,145 | $8,365 |
| 2014 | $3,979 | $10,510 | $2,145 | $8,365 |
| 2013 | $4,232 | $12,028 | $2,145 | $9,883 |
Source: Public Records
Map
Nearby Homes
- 17706 Wentworth Ave
- 17702 Bernadine St
- 17611 Bernadine St
- 17517 Shirley Dr
- 17511 Maple Ave
- 3336 178th St
- 17603 Community St
- 3423 Adams St
- 17614 Community St
- 7624 Forest Ave
- 17519 Community St
- 17922 State Line Ave
- 3238 178th St
- 17552 Roy St
- 17945 Maple St
- 17518 Roy St
- 3540 Bernice Rd
- 17641 Burnham Ave
- 108 Beverly Place
- 17745 Burnham Ave
- 17711 Bernadine St
- 17717 Bernadine St
- 17712 Wentworth Ave
- 17721 Bernadine St
- 17659 Bernadine St
- 17720 Wentworth Ave
- 17720 Wentworth Ave
- 17720 Wentworth Ave
- 17702 Bernadine St
- 17727 Bernadine St
- 17724 Wentworth Ave
- 17724 Wentworth Ave
- 17716 Bernadine St
- 17658 Wentworth Ave
- 17658 Wentworth Ave
- 17651 Bernadine St
- 17730 Wentworth Ave
- 17726 Bernadine St
- 17733 Bernadine St
- 17658 Bernadine St