J
Seller's Agent in 2025
Jason Davis
Real People Realty
(815) 469-7449
3 in this area
36 Total Sales
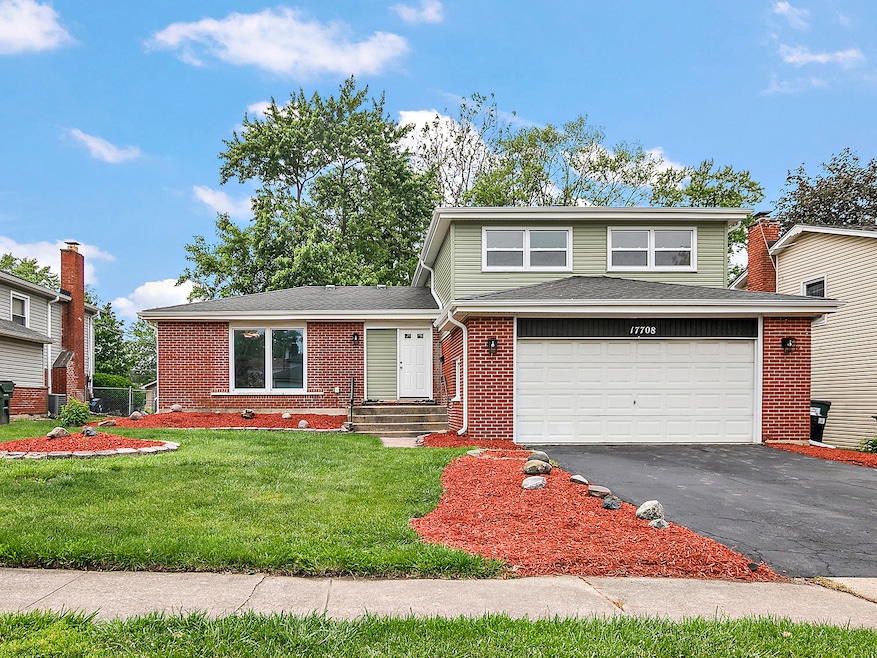
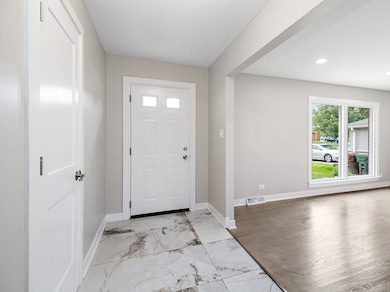
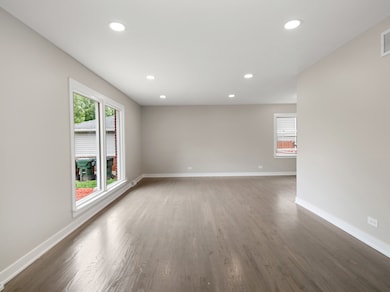
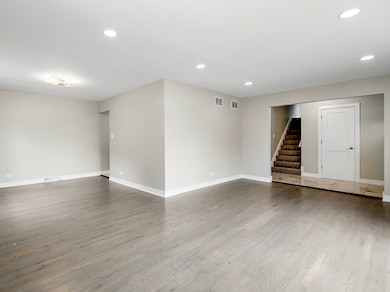
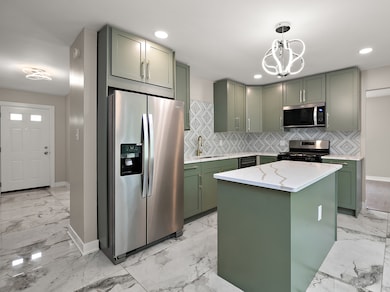

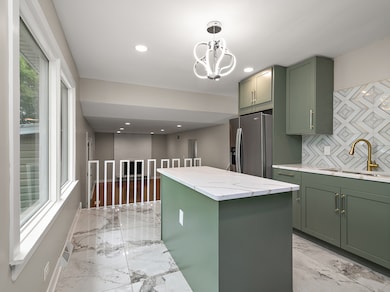
Freshly Renovated 4 bedroom (1 under grade), 2.5 bath, Split Level home minutes from amenities and Interstates offering comfort, style and functionality. Modern tile flooring and hardwood provides a stylish current look . Kitchen updated with modern design, Quartz counter tops and island, Over sized Cabinets, and Stainless Steel Appliances. All 3 bathrooms are styled with Modern Tile and Premium Fixtures. Two-car attached garage with curb appeal located on quiet block.
Last Agent to Sell the Property
Real People Realty License #475177119 Listed on: 06/07/2025

Last Buyer's Agent
Donnetria Hawkins
Keller Williams Preferred Rlty License #475210349
| Date | Type | Sale Price | Title Company |
|---|---|---|---|
| Warranty Deed | $285,000 | None Listed On Document | |
| Warranty Deed | $130,000 | None Listed On Document | |
| Warranty Deed | $130,000 | None Listed On Document | |
| Warranty Deed | $96,000 | Cti | |
| Quit Claim Deed | -- | None Available | |
| Warranty Deed | $8,000 | None Available |
| Date | Status | Loan Amount | Loan Type |
|---|---|---|---|
| Open | $279,837 | FHA | |
| Previous Owner | $162,450 | Construction | |
| Previous Owner | $91,100 | Purchase Money Mortgage |
| Date | Event | Price | List to Sale | Price per Sq Ft |
|---|---|---|---|---|
| 08/13/2025 08/13/25 | Sold | $285,000 | 0.0% | $157 / Sq Ft |
| 06/20/2025 06/20/25 | Pending | -- | -- | -- |
| 06/07/2025 06/07/25 | For Sale | $285,000 | -- | $157 / Sq Ft |
| Year | Tax Paid | Tax Assessment Tax Assessment Total Assessment is a certain percentage of the fair market value that is determined by local assessors to be the total taxable value of land and additions on the property. | Land | Improvement |
|---|---|---|---|---|
| 2025 | $8,725 | $23,000 | $3,039 | $19,961 |
| 2024 | $8,725 | $23,000 | $3,039 | $19,961 |
| 2023 | $3,818 | $23,000 | $3,039 | $19,961 |
| 2022 | $3,818 | $11,358 | $2,681 | $8,677 |
| 2021 | $2,504 | $11,357 | $2,681 | $8,676 |
| 2020 | $2,214 | $11,357 | $2,681 | $8,676 |
| 2019 | $2,440 | $13,249 | $2,502 | $10,747 |
| 2018 | $2,369 | $13,249 | $2,502 | $10,747 |
| 2017 | $2,174 | $13,249 | $2,502 | $10,747 |
| 2016 | $3,468 | $10,212 | $2,145 | $8,067 |
| 2015 | $4,491 | $12,515 | $2,145 | $10,370 |
| 2014 | $3,429 | $12,515 | $2,145 | $10,370 |
| 2013 | $4,863 | $14,663 | $2,145 | $12,518 |
J
Seller's Agent in 2025
Jason Davis
Real People Realty
(815) 469-7449
3 in this area
36 Total Sales
D
Buyer's Agent in 2025
Donnetria Hawkins
Keller Williams Preferred Rlty
Source: Midwest Real Estate Data (MRED)
MLS Number: 12387291
APN: 28-36-107-018-0000
Disclaimer: Certain information contained herein is derived from information provided by parties other than Homes.com. All information provided is deemed reliable, but is not guaranteed to be accurate and should be independently verified.
![]() Based on information submitted to the MLS GRID. All data is obtained from various sources and may not have been verified by broker or MLS GRID. Supplied Open House Information is subject to change without notice. All information should be independently reviewed and verified for accuracy. Properties may or may not be listed by the office/agent presenting the information. Some IDX listings have been excluded from this website.
Based on information submitted to the MLS GRID. All data is obtained from various sources and may not have been verified by broker or MLS GRID. Supplied Open House Information is subject to change without notice. All information should be independently reviewed and verified for accuracy. Properties may or may not be listed by the office/agent presenting the information. Some IDX listings have been excluded from this website.
Based on information submitted to the MLS GRID
Ask me questions while you tour the home.