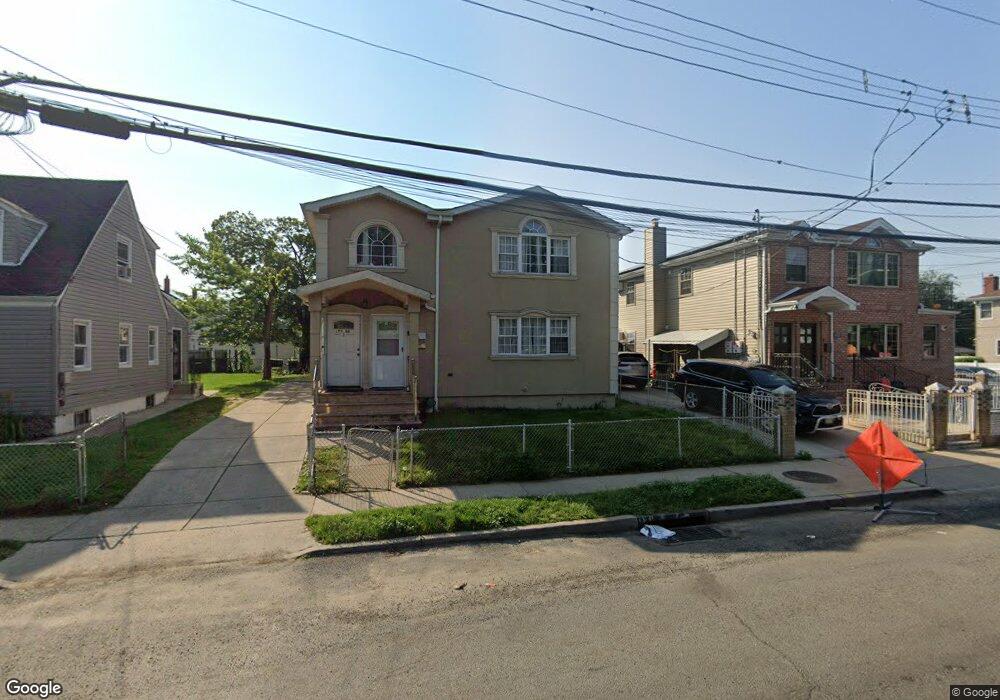
17708 Sayres Ave Jamaica, NY 11433
Saint Albans NeighborhoodEstimated Value: $958,000 - $1,290,000
--
Bed
--
Bath
3,400
Sq Ft
$348/Sq Ft
Est. Value
About This Home
This home is located at 17708 Sayres Ave, Jamaica, NY 11433 and is currently estimated at $1,181,931, approximately $347 per square foot. 17708 Sayres Ave is a home located in Queens County with nearby schools including Ps 36 St Albans School, Is 59 Springfield Gardens, and Allen Christian School.
Ownership History
Date
Name
Owned For
Owner Type
Purchase Details
Closed on
Mar 16, 2022
Sold by
Brown Natalie and Philip Shaw Revocable Trust
Bought by
177-08 Sayres Llc
Current Estimated Value
Home Financials for this Owner
Home Financials are based on the most recent Mortgage that was taken out on this home.
Original Mortgage
$450,000
Outstanding Balance
$419,341
Interest Rate
3.69%
Mortgage Type
Assumption
Estimated Equity
$762,590
Purchase Details
Closed on
Jun 11, 2020
Sold by
Shaw Philip
Bought by
Brown Natalie and Philip Shaw Revocable Trust
Purchase Details
Closed on
May 11, 2015
Sold by
Amaani Realty Group Llc
Bought by
Myles Leanora and Nugent Leanora
Purchase Details
Closed on
Sep 8, 2014
Sold by
Clark Deceased Gloria V
Bought by
Amaani Realty Group Llc
Home Financials for this Owner
Home Financials are based on the most recent Mortgage that was taken out on this home.
Original Mortgage
$225,000
Interest Rate
4.12%
Mortgage Type
Commercial
Create a Home Valuation Report for This Property
The Home Valuation Report is an in-depth analysis detailing your home's value as well as a comparison with similar homes in the area
Home Values in the Area
Average Home Value in this Area
Purchase History
| Date | Buyer | Sale Price | Title Company |
|---|---|---|---|
| 177-08 Sayres Llc | $850,000 | -- | |
| Brown Natalie | -- | -- | |
| Myles Leanora | $745,000 | -- | |
| Amaani Realty Group Llc | $330,000 | -- |
Source: Public Records
Mortgage History
| Date | Status | Borrower | Loan Amount |
|---|---|---|---|
| Open | 177-08 Sayres Llc | $450,000 | |
| Previous Owner | Amaani Realty Group Llc | $225,000 |
Source: Public Records
Tax History Compared to Growth
Tax History
| Year | Tax Paid | Tax Assessment Tax Assessment Total Assessment is a certain percentage of the fair market value that is determined by local assessors to be the total taxable value of land and additions on the property. | Land | Improvement |
|---|---|---|---|---|
| 2025 | $6,224 | $32,540 | $7,931 | $24,609 |
| 2024 | $6,224 | $30,986 | $7,092 | $23,894 |
| 2023 | $5,929 | $29,521 | $5,971 | $23,550 |
| 2022 | $5,859 | $52,860 | $12,840 | $40,020 |
| 2021 | $6,049 | $52,620 | $12,840 | $39,780 |
| 2020 | $5,740 | $47,280 | $12,840 | $34,440 |
| 2019 | $5,402 | $40,500 | $12,840 | $27,660 |
| 2018 | $5,015 | $24,601 | $6,672 | $17,929 |
| 2017 | $4,986 | $24,457 | $8,255 | $16,202 |
| 2016 | $4,266 | $24,457 | $8,255 | $16,202 |
| 2015 | $1,863 | $19,077 | $10,474 | $8,603 |
| 2014 | $1,863 | $17,998 | $11,857 | $6,141 |
Source: Public Records
Map
Nearby Homes
- 177-08 Sayres Ave
- 17718 Sayres Ave
- 17709 112th Ave
- 111-54 178th Place
- 112-13 178th St
- 110-40 176th St
- 112- 2 178th St
- 112-26 176th St
- 112-45 178th St
- 11245 178th St
- 11176 180th St
- 10944 177th St
- 109-49 176th St
- 110-01 175th St
- 179-07 Murdock Ave
- 17210 111th Ave
- 17209 Sayres Ave
- 10912 176th St
- 172-18 111th Ave
- 11023 172nd St
- 17712 Sayres Ave
- 17712 Sayres Ave
- 17704 Sayres Ave
- 11117 177th St
- 111-22 178th St
- 11112 178th St
- 11112 178th St
- 11119 177th St
- 111-19 177th St
- 11116 178th St
- 11118 178th St
- 177-11 Sayres Ave
- 11118 178th St
- 17620 Sayres Ave
- 177-07 Sayres Ave
- 11121 177th St
- 17620 Sayres Ave
- 178-02 Sayres Ave
- 11122 178th St
- 17711 Sayres Ave