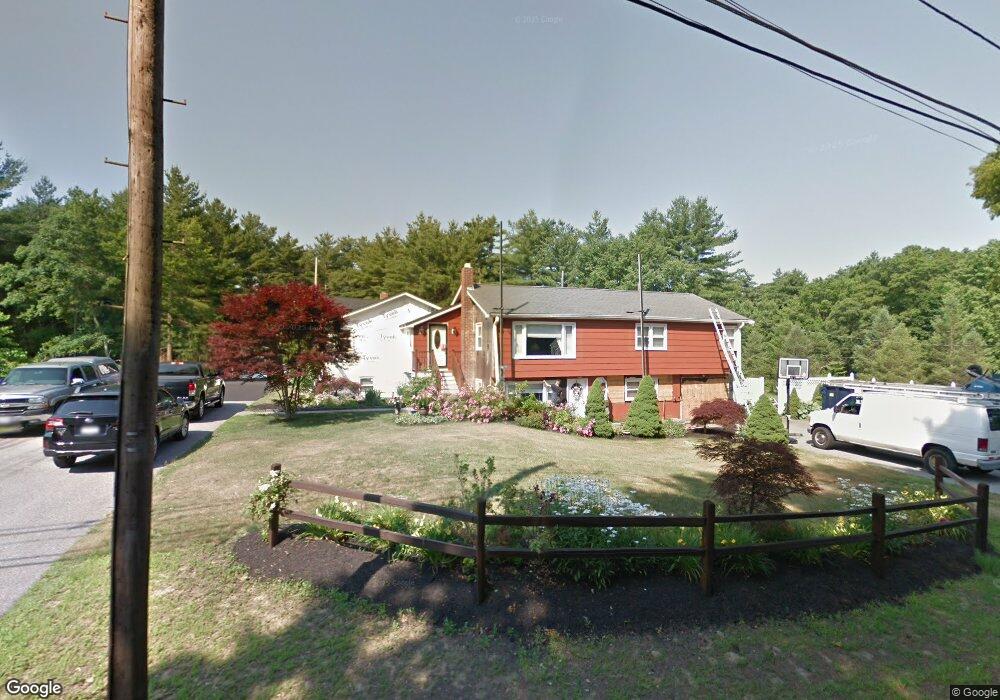
1771 West St Wrentham, MA 02093
West Wrentham NeighborhoodEstimated Value: $659,000 - $778,000
4
Beds
3
Baths
1,776
Sq Ft
$400/Sq Ft
Est. Value
About This Home
This home is located at 1771 West St, Wrentham, MA 02093 and is currently estimated at $709,869, approximately $399 per square foot. 1771 West St is a home located in Norfolk County with nearby schools including Delaney Elementary School, Charles E Roderick, and Mercymount Country Day School.
Ownership History
Date
Name
Owned For
Owner Type
Purchase Details
Closed on
Jun 16, 2017
Sold by
Najarian Dean M
Bought by
Najarian Dean N and Najarian Susan M
Current Estimated Value
Purchase Details
Closed on
May 23, 2012
Sold by
Najarian Dean M and Najarian Jody M
Bought by
Najarian Dean M
Home Financials for this Owner
Home Financials are based on the most recent Mortgage that was taken out on this home.
Original Mortgage
$336,500
Interest Rate
3.88%
Mortgage Type
New Conventional
Purchase Details
Closed on
May 26, 1999
Sold by
Assoc Home Equity Svcs
Bought by
Najarian Dean M
Purchase Details
Closed on
Feb 3, 1999
Sold by
Cloutier Jeanne T and Cloutier Paul A
Bought by
Assoc Home Equity Svcs
Purchase Details
Closed on
Nov 1, 1995
Sold by
Archambault Jacqueline
Bought by
Cloutier Paul A and Cloutier Jeane T
Create a Home Valuation Report for This Property
The Home Valuation Report is an in-depth analysis detailing your home's value as well as a comparison with similar homes in the area
Home Values in the Area
Average Home Value in this Area
Purchase History
| Date | Buyer | Sale Price | Title Company |
|---|---|---|---|
| Najarian Dean N | -- | -- | |
| Najarian Dean M | -- | -- | |
| Najarian Dean M | -- | -- | |
| Cloutier Paul A | $70,000 | -- | |
| Najarian Dean N | -- | -- | |
| Najarian Dean M | -- | -- | |
| Najarian Dean M | $165,000 | -- | |
| Assoc Home Equity Svcs | $225,263 | -- | |
| Cloutier Paul A | $70,000 | -- |
Source: Public Records
Mortgage History
| Date | Status | Borrower | Loan Amount |
|---|---|---|---|
| Previous Owner | Najarian Dean M | $336,500 |
Source: Public Records
Tax History Compared to Growth
Tax History
| Year | Tax Paid | Tax Assessment Tax Assessment Total Assessment is a certain percentage of the fair market value that is determined by local assessors to be the total taxable value of land and additions on the property. | Land | Improvement |
|---|---|---|---|---|
| 2025 | $7,521 | $648,900 | $288,000 | $360,900 |
| 2024 | $7,154 | $596,200 | $288,000 | $308,200 |
| 2023 | $6,950 | $550,700 | $261,900 | $288,800 |
| 2022 | $6,942 | $507,800 | $255,100 | $252,700 |
| 2021 | $6,150 | $437,100 | $238,400 | $198,700 |
| 2020 | $6,344 | $445,200 | $182,000 | $263,200 |
| 2019 | $5,830 | $412,900 | $163,800 | $249,100 |
| 2018 | $6,039 | $424,100 | $163,600 | $260,500 |
| 2017 | $5,627 | $394,900 | $160,500 | $234,400 |
| 2016 | $5,506 | $385,600 | $155,800 | $229,800 |
| 2015 | $5,555 | $370,800 | $166,500 | $204,300 |
| 2014 | $5,469 | $357,200 | $160,100 | $197,100 |
Source: Public Records
Map
Nearby Homes
- 50 Wamsutta Way
- 236 Williams St
- 60 Grant Ave
- 50 Heather Ln
- 2095 West St
- 39 Sumner Brown Rd
- 180 Pine Swamp Rd
- 56 Pine Swamp Rd
- 25 Nature View Dr
- 17 Stanford Rd
- 20 Nature View Dr
- 10 Stanford Rd
- 851 Washington St
- 584 Washington St
- 955 Summer St
- 300 Tower Hill Rd
- 4022 Diamond Hill Rd
- 9 Pebble Cir Unit 9
- 4 Evans St
- 2 Duhamel Way
- 1766 West St
- 1761 West St
- 1782 West St
- 1785 West St
- 1758 West St
- 1800 West St
- 39 Williams St
- 1779 West St
- 1807 West St
- 54 Williams St
- 0 Williams St Unit 71641161
- 2 Williams St
- 1 Williams St
- 3 Williams St
- 5 Williams St
- 4 Williams St
- 0 W Street 1700 Unit 72291632
- 1840 West St
- 28 Williams St
- 16 Williams St