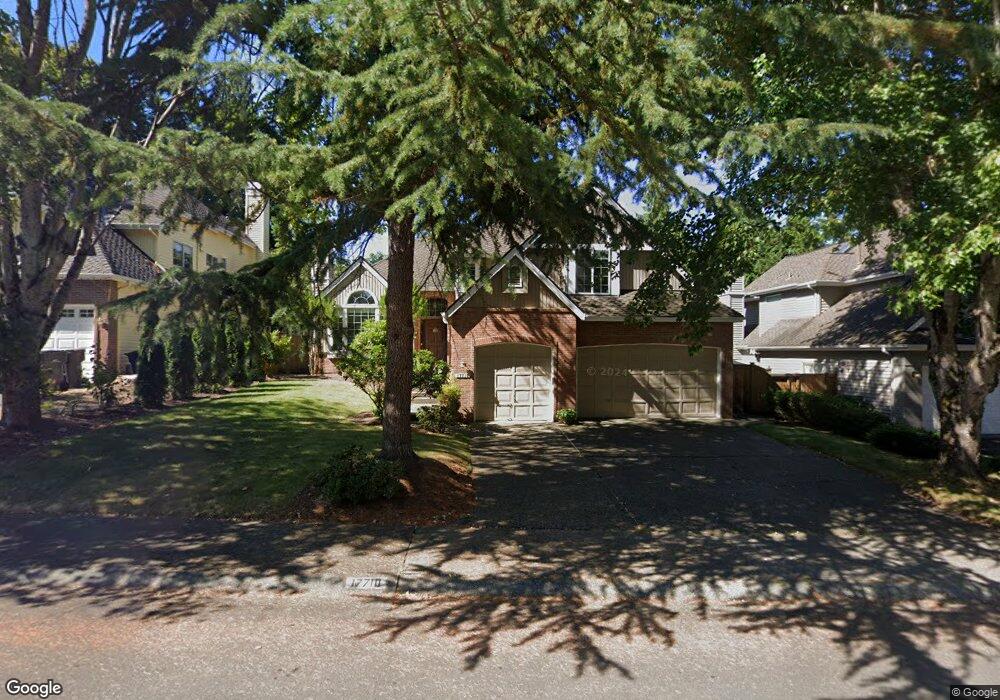
17710 NE 104th Way Redmond, WA 98052
Education Hill NeighborhoodEstimated Value: $1,683,000 - $2,042,000
4
Beds
3
Baths
2,500
Sq Ft
$745/Sq Ft
Est. Value
About This Home
This home is located at 17710 NE 104th Way, Redmond, WA 98052 and is currently estimated at $1,861,937, approximately $744 per square foot. 17710 NE 104th Way is a home located in King County with nearby schools including Mann Elementary, Redmond Middle School, and Redmond High School.
Ownership History
Date
Name
Owned For
Owner Type
Purchase Details
Closed on
Nov 29, 2004
Sold by
Feldman Loren N and Feldman Michelle M
Bought by
Trufinescu Tudor M and Trufinescu Adina M
Current Estimated Value
Home Financials for this Owner
Home Financials are based on the most recent Mortgage that was taken out on this home.
Original Mortgage
$300,000
Outstanding Balance
$149,439
Interest Rate
5.65%
Mortgage Type
Purchase Money Mortgage
Estimated Equity
$1,712,498
Purchase Details
Closed on
Jul 31, 1997
Sold by
Timmins Kelley A and Timmins Marci A
Bought by
Feldman Loren N and Feldman Michelle M
Home Financials for this Owner
Home Financials are based on the most recent Mortgage that was taken out on this home.
Original Mortgage
$214,600
Interest Rate
7.58%
Mortgage Type
Balloon
Purchase Details
Closed on
Nov 30, 1992
Sold by
Nintendo Of America Inc
Bought by
Timmins Kelley A and Timmins Marci A
Purchase Details
Closed on
Nov 13, 1992
Sold by
Murauchi Akitzugu and Murauchi Mariko
Bought by
Nintendo Of America Inc
Create a Home Valuation Report for This Property
The Home Valuation Report is an in-depth analysis detailing your home's value as well as a comparison with similar homes in the area
Home Values in the Area
Average Home Value in this Area
Purchase History
| Date | Buyer | Sale Price | Title Company |
|---|---|---|---|
| Trufinescu Tudor M | $541,990 | Lawyers Title | |
| Feldman Loren N | $317,950 | Transnation Title Insurance | |
| Timmins Kelley A | $242,500 | -- | |
| Nintendo Of America Inc | $286,200 | -- |
Source: Public Records
Mortgage History
| Date | Status | Borrower | Loan Amount |
|---|---|---|---|
| Open | Trufinescu Tudor M | $300,000 | |
| Previous Owner | Feldman Loren N | $214,600 | |
| Closed | Trufinescu Tudor M | $90,000 |
Source: Public Records
Tax History Compared to Growth
Tax History
| Year | Tax Paid | Tax Assessment Tax Assessment Total Assessment is a certain percentage of the fair market value that is determined by local assessors to be the total taxable value of land and additions on the property. | Land | Improvement |
|---|---|---|---|---|
| 2024 | $12,376 | $1,575,000 | $667,000 | $908,000 |
| 2023 | $12,137 | $1,325,000 | $567,000 | $758,000 |
| 2022 | $9,941 | $1,651,000 | $710,000 | $941,000 |
| 2021 | $9,158 | $1,156,000 | $497,000 | $659,000 |
| 2020 | $9,465 | $984,000 | $424,000 | $560,000 |
| 2018 | $8,421 | $926,000 | $335,000 | $591,000 |
| 2017 | $7,035 | $843,000 | $309,000 | $534,000 |
| 2016 | $6,831 | $735,000 | $278,000 | $457,000 |
| 2015 | $6,497 | $707,000 | $269,000 | $438,000 |
| 2014 | -- | $649,000 | $250,000 | $399,000 |
| 2013 | -- | $510,000 | $219,000 | $291,000 |
Source: Public Records
Map
Nearby Homes
- 9717 178th Place NE Unit 3
- 16825 NE 106th St
- 11316 178th Place NE
- 10909 Avondale Rd NE Unit R170
- 0 113th St E Unit SR25128907
- 9805 Avondale Rd NE Unit L238
- 9805 Avondale Rd NE Unit T254
- 11418 179th Ct NE
- 16709 NE 102nd Place
- 16704 NE 102nd Place
- 16915 NE 98th Ct
- 17228 NE 113th Ct
- 10417 165th Place NE
- 16725 NE 97th St
- 16704 NE 97th St
- 9064 177th Place NE
- 9009 Avondale Rd NE Unit D107
- 9408 168th Place NE
- 11217 167th Ct NE
- 10925 165th Place NE
- 17702 NE 104th Way
- 17718 NE 104th Way
- 17709 NE 105th St
- 17726 NE 104th Way
- 17723 NE 105th Way
- 17705 NE 105th St
- 10412 176th Place NE
- 17715 NE 105th Way
- 17715 NE 105th St
- 17711 NE 104th Way
- 10502 176th Place NE
- 17703 NE 104th Way
- 17719 NE 104th Way
- 17731 NE 105th Way
- 17734 NE 104th Way
- 17727 NE 104th Way
- 10508 176th Place NE
- 17617 NE 104th Way
- 17735 NE 104th Way
- 17817 NE 105th Way