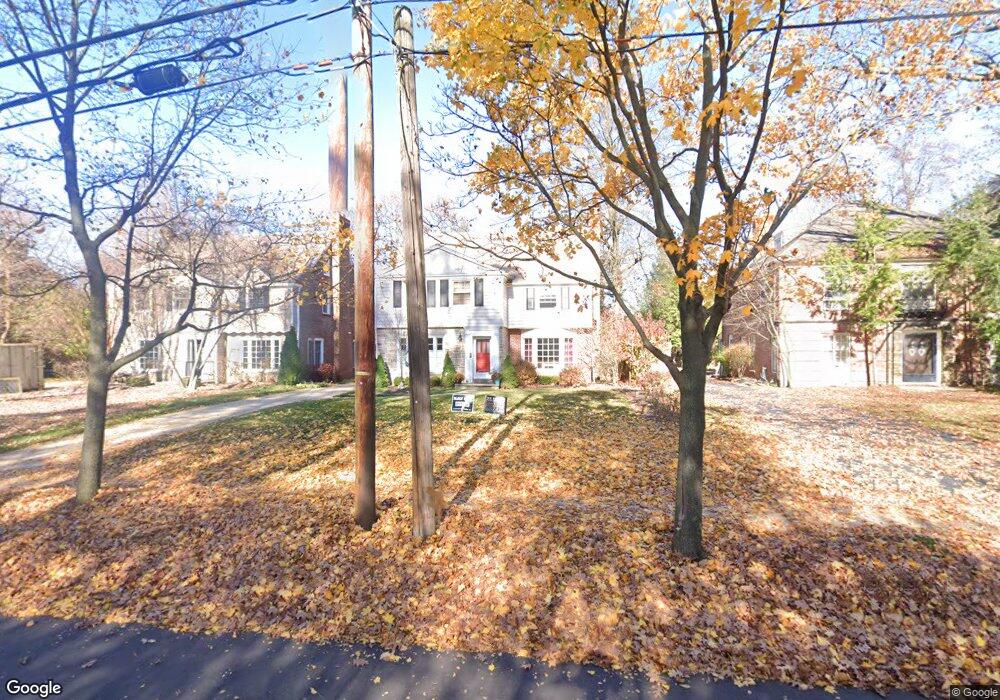
17713 Fernway Rd Shaker Heights, OH 44122
Estimated Value: $403,000 - $473,000
4
Beds
4
Baths
2,041
Sq Ft
$212/Sq Ft
Est. Value
About This Home
This home is located at 17713 Fernway Rd, Shaker Heights, OH 44122 and is currently estimated at $433,592, approximately $212 per square foot. 17713 Fernway Rd is a home located in Cuyahoga County with nearby schools including Fernway Elementary School, Woodbury Elementary School, and Shaker Heights Middle School.
Ownership History
Date
Name
Owned For
Owner Type
Purchase Details
Closed on
May 19, 2010
Sold by
Yule Bruce D and Yule Lynn
Bought by
Cole Kimberly H and Brown Jeffrey D
Current Estimated Value
Home Financials for this Owner
Home Financials are based on the most recent Mortgage that was taken out on this home.
Original Mortgage
$235,600
Outstanding Balance
$154,550
Interest Rate
4.62%
Mortgage Type
New Conventional
Estimated Equity
$279,042
Purchase Details
Closed on
Dec 16, 1992
Sold by
Faist Jerome L
Bought by
Yule Bruce D
Purchase Details
Closed on
Dec 7, 1981
Sold by
Mulleneaux Gordon L
Bought by
Faist Jerome L
Purchase Details
Closed on
Apr 24, 1980
Sold by
Lee Robert B
Bought by
Mulleneaux Gordon L
Purchase Details
Closed on
Sep 15, 1978
Sold by
Clarke Samuel F and R M
Bought by
Lee Robert B
Purchase Details
Closed on
Jan 1, 1975
Bought by
Clarke Samuel F and R M
Create a Home Valuation Report for This Property
The Home Valuation Report is an in-depth analysis detailing your home's value as well as a comparison with similar homes in the area
Home Values in the Area
Average Home Value in this Area
Purchase History
| Date | Buyer | Sale Price | Title Company |
|---|---|---|---|
| Cole Kimberly H | $248,000 | Signature Title | |
| Yule Bruce D | $172,000 | -- | |
| Faist Jerome L | $90,000 | -- | |
| Mulleneaux Gordon L | $93,500 | -- | |
| Lee Robert B | $84,500 | -- | |
| Clarke Samuel F | -- | -- |
Source: Public Records
Mortgage History
| Date | Status | Borrower | Loan Amount |
|---|---|---|---|
| Open | Cole Kimberly H | $235,600 |
Source: Public Records
Tax History Compared to Growth
Tax History
| Year | Tax Paid | Tax Assessment Tax Assessment Total Assessment is a certain percentage of the fair market value that is determined by local assessors to be the total taxable value of land and additions on the property. | Land | Improvement |
|---|---|---|---|---|
| 2024 | $11,223 | $126,070 | $22,610 | $103,460 |
| 2023 | $10,969 | $97,580 | $18,410 | $79,170 |
| 2022 | $10,644 | $97,580 | $18,410 | $79,170 |
| 2021 | $10,608 | $97,580 | $18,410 | $79,170 |
| 2020 | $10,547 | $91,210 | $17,220 | $73,990 |
| 2019 | $10,395 | $260,600 | $49,200 | $211,400 |
| 2018 | $10,455 | $91,210 | $17,220 | $73,990 |
| 2017 | $10,448 | $86,700 | $15,610 | $71,090 |
| 2016 | $10,028 | $86,700 | $15,610 | $71,090 |
| 2015 | $9,462 | $86,700 | $15,610 | $71,090 |
| 2014 | $9,462 | $78,830 | $14,180 | $64,650 |
Source: Public Records
Map
Nearby Homes
- 17419 Fernway Rd
- 3296 Grenway Rd
- 3345 Kenmore Rd
- 3315 Elsmere Rd
- 17015 Fernway Rd
- 18401 S Woodland Rd
- 2945 Fontenay Rd
- 3356 Daleford Rd
- 2890 Torrington Rd
- 17007 Van Aken Blvd Unit 107
- 17007 Van Aken Blvd Unit 101
- 17007 Van Aken Blvd Unit 2
- 18019 Chagrin Blvd
- 18520 Van Aken Blvd
- 18416 Winslow Rd
- 3360 Stockholm Rd
- 18112 Chagrin Blvd
- 19200 S Woodland Rd
- 18975 Van Aken Blvd Unit 407
- 18975 Van Aken Blvd Unit 401
- 17719 Fernway Rd
- 17711 Fernway Rd
- 17725 Fernway Rd
- 17701 Fernway Rd
- 17729 Fernway Rd
- 17800 Parkland Dr
- 3255 Glencairn Rd
- 17627 Fernway Rd
- 3256 Grenway Rd
- 17803 Fernway Rd
- 17814 Parkland Dr
- 17700 Parkland Dr
- 3259 Glencairn Rd
- 17809 Fernway Rd
- 3260 Grenway Rd
- 3256 Glencairn Rd
- 3263 Glencairn Rd
- 17611 Fernway Rd
- 17906 Parkland Dr
- 17815 Fernway Rd