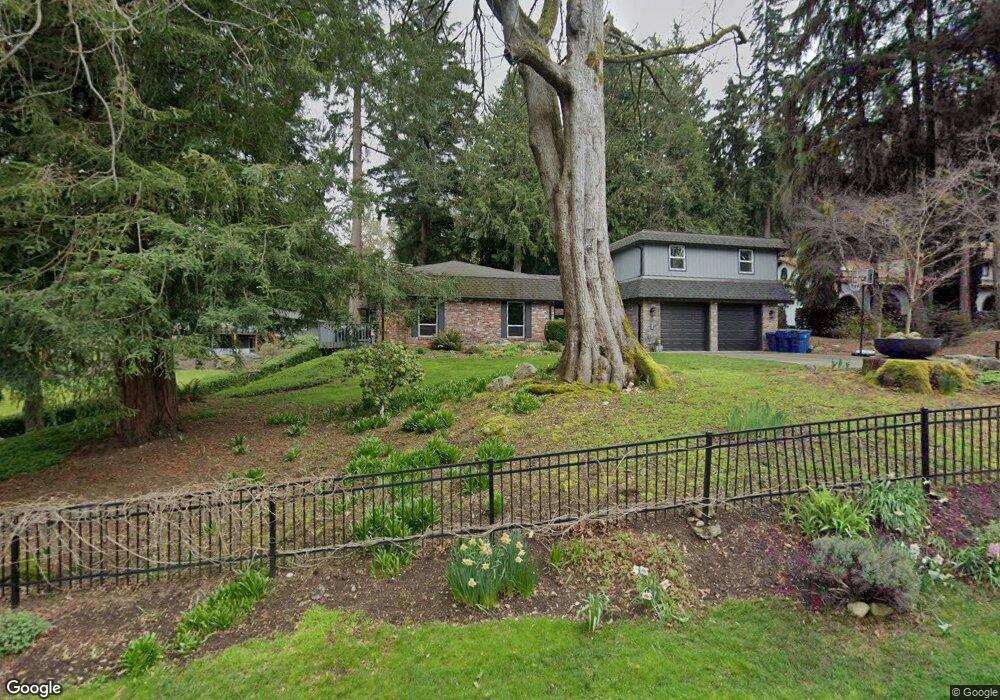
17717 Talbot Rd Edmonds, WA 98026
Talbot Park NeighborhoodEstimated Value: $1,710,000 - $1,854,000
5
Beds
4
Baths
3,336
Sq Ft
$536/Sq Ft
Est. Value
About This Home
This home is located at 17717 Talbot Rd, Edmonds, WA 98026 and is currently estimated at $1,786,969, approximately $535 per square foot. 17717 Talbot Rd is a home located in Snohomish County with nearby schools including Edmonds Elementary School, Meadowdale Middle School, and Meadowdale High School.
Ownership History
Date
Name
Owned For
Owner Type
Purchase Details
Closed on
Jan 24, 2015
Sold by
Deboer Shane R and Deboer Heidi Thorstenson
Bought by
Deboer Shane R and Deboer Heidi T
Current Estimated Value
Home Financials for this Owner
Home Financials are based on the most recent Mortgage that was taken out on this home.
Original Mortgage
$350,000
Outstanding Balance
$107,215
Interest Rate
3.03%
Mortgage Type
New Conventional
Estimated Equity
$1,679,754
Purchase Details
Closed on
Jun 9, 2006
Sold by
Middendorf Douglas J and Middendorf Joan
Bought by
Deboer Shane R and Thorstenson Heidi R
Home Financials for this Owner
Home Financials are based on the most recent Mortgage that was taken out on this home.
Original Mortgage
$560,000
Interest Rate
6.55%
Mortgage Type
Fannie Mae Freddie Mac
Create a Home Valuation Report for This Property
The Home Valuation Report is an in-depth analysis detailing your home's value as well as a comparison with similar homes in the area
Home Values in the Area
Average Home Value in this Area
Purchase History
| Date | Buyer | Sale Price | Title Company |
|---|---|---|---|
| Deboer Shane R | -- | First American | |
| Deboer Shane R | $730,000 | First American |
Source: Public Records
Mortgage History
| Date | Status | Borrower | Loan Amount |
|---|---|---|---|
| Open | Deboer Shane R | $350,000 | |
| Closed | Deboer Shane R | $560,000 |
Source: Public Records
Tax History
| Year | Tax Paid | Tax Assessment Tax Assessment Total Assessment is a certain percentage of the fair market value that is determined by local assessors to be the total taxable value of land and additions on the property. | Land | Improvement |
|---|---|---|---|---|
| 2026 | $11,521 | $1,778,500 | $1,168,700 | $609,800 |
| 2025 | $10,150 | $1,633,600 | $1,044,000 | $589,600 |
| 2024 | $10,150 | $1,435,700 | $874,200 | $561,500 |
| 2023 | $9,926 | $1,454,800 | $807,700 | $647,100 |
| 2022 | $9,448 | $1,138,600 | $589,000 | $549,600 |
| 2020 | $10,153 | $1,091,700 | $552,300 | $539,400 |
| 2019 | $9,814 | $1,065,400 | $531,700 | $533,700 |
| 2018 | $9,884 | $927,000 | $448,800 | $478,200 |
| 2017 | $9,094 | $893,400 | $444,600 | $448,800 |
| 2016 | $8,534 | $831,300 | $402,000 | $429,300 |
| 2015 | $7,906 | $725,200 | $307,000 | $418,200 |
| 2013 | $6,701 | $580,400 | $237,000 | $343,400 |
Source: Public Records
Map
Nearby Homes
- 9225 Olympic View Dr
- 18431 High St
- 8036 Cyrus Place
- 8001 Talbot Rd
- 7810 175th St SW
- 8125 186th St SW
- 7929 Cyrus Place
- 18726 92nd Ave W
- 192 XX Olympic View Dr
- 17003 Talbot Rd
- 8515 192nd St SW
- 7416 176th St SW
- 7407 180th St SW
- 18775 76th Ave W
- 16858 76th Ave W
- 18757 76th Ave W
- 17926 73rd Ave W
- 19209 Olympic View Dr
- 18312 73rd Ave W
- 18917 76th Ave W
- 17715 Talbot Rd
- 233 88 Ave W
- 197 88th Ave W
- 17819 Talbot Rd
- 17709 Talbot Rd
- 17839 Talbot Rd
- 17004 Talbot Rd
- 17826 Talbot Rd
- 17905 Talbot Rd
- 17836 Talbot Rd
- 17808 Talbot Rd
- 17627 Talbot Rd
- 17742 Talbot Rd
- 8933 179th Place SW
- 17927 Talbot Rd
- 8928 179th Place SW
- 231 85th Place W
- 8935 179th Place SW
- 17720 Talbot Rd
Your Personal Tour Guide
Ask me questions while you tour the home.