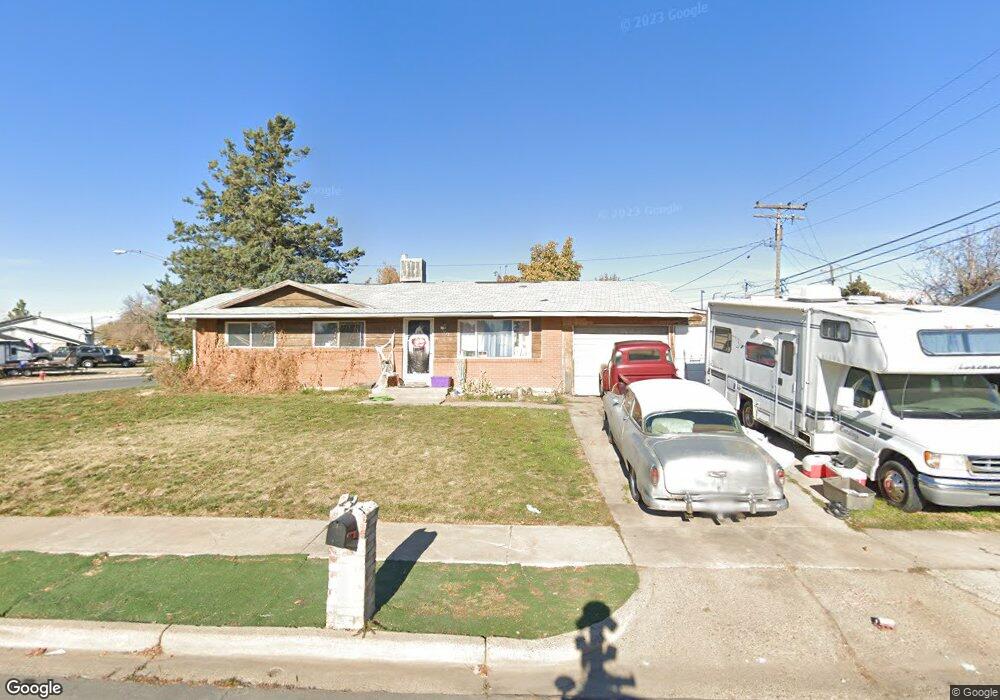
1772 Alfred Dr Layton, UT 84041
Estimated Value: $369,000 - $419,000
4
Beds
2
Baths
1,025
Sq Ft
$388/Sq Ft
Est. Value
About This Home
This home is located at 1772 Alfred Dr, Layton, UT 84041 and is currently estimated at $397,758, approximately $388 per square foot. 1772 Alfred Dr is a home located in Davis County with nearby schools including Vae View Elementary School, Central Davis Junior High School, and Layton High School.
Ownership History
Date
Name
Owned For
Owner Type
Purchase Details
Closed on
Dec 28, 2016
Sold by
Tucker Alice F
Bought by
Tucker Alice
Current Estimated Value
Purchase Details
Closed on
Jul 26, 2001
Sold by
Va
Bought by
Tucker Alice F
Home Financials for this Owner
Home Financials are based on the most recent Mortgage that was taken out on this home.
Original Mortgage
$90,198
Interest Rate
7.15%
Purchase Details
Closed on
Mar 14, 2001
Sold by
Ba Mtg Llc
Bought by
Va
Purchase Details
Closed on
Jan 15, 2001
Sold by
Mihlfeith Glen L
Bought by
B A Mtg Llc
Purchase Details
Closed on
Jan 12, 2001
Sold by
B A Mtg Llc
Bought by
Va
Purchase Details
Closed on
Apr 22, 2000
Sold by
Jbd Real Estate Holding Trust and Passey Joel
Bought by
Mihlfeith Glen L
Purchase Details
Closed on
Jun 16, 1999
Sold by
Mihlfeith Glen L
Bought by
Passey Joel and Passey Florence
Create a Home Valuation Report for This Property
The Home Valuation Report is an in-depth analysis detailing your home's value as well as a comparison with similar homes in the area
Home Values in the Area
Average Home Value in this Area
Purchase History
| Date | Buyer | Sale Price | Title Company |
|---|---|---|---|
| Tucker Alice | -- | -- | |
| Tucker Alice F | -- | Us Title | |
| Va | -- | First American Title Co | |
| B A Mtg Llc | -- | Guardian Title Company | |
| Va | -- | First American Title Co | |
| Mihlfeith Glen L | -- | -- | |
| Passey Joel | -- | -- |
Source: Public Records
Mortgage History
| Date | Status | Borrower | Loan Amount |
|---|---|---|---|
| Previous Owner | Tucker Alice F | $90,198 |
Source: Public Records
Tax History Compared to Growth
Tax History
| Year | Tax Paid | Tax Assessment Tax Assessment Total Assessment is a certain percentage of the fair market value that is determined by local assessors to be the total taxable value of land and additions on the property. | Land | Improvement |
|---|---|---|---|---|
| 2025 | -- | $215,600 | $102,678 | $112,922 |
| 2024 | $197 | $212,299 | $122,509 | $89,790 |
| 2023 | $1,948 | $199,650 | $86,299 | $113,350 |
| 2022 | $2,108 | $388,000 | $134,952 | $253,048 |
| 2021 | $521 | $290,000 | $106,519 | $183,481 |
| 2020 | $1,602 | $232,000 | $78,944 | $153,056 |
| 2019 | $1,593 | $226,000 | $75,910 | $150,090 |
| 2018 | $1,391 | $198,000 | $70,287 | $127,713 |
| 2016 | $358 | $81,345 | $19,952 | $61,393 |
| 2015 | $1,073 | $74,800 | $19,952 | $54,848 |
| 2014 | $264 | $77,000 | $19,952 | $57,048 |
| 2013 | -- | $72,046 | $20,680 | $51,366 |
Source: Public Records
Map
Nearby Homes
- 1916 W Gregory Dr
- 1740 N Gregory Dr
- 1954 Ann St
- 1900 N 1690 W
- 1650 N Main St Unit 126
- 1937 W 1620 N
- Highbridge 3 Plan at Layton Towns on Main - Townhomes
- Highbridge 1 Plan at Layton Towns on Main - Townhomes
- Midtown Plan at Layton Towns on Main - Townhomes
- Cityline 1 Plan at Layton Towns on Main - Townhomes
- Cityline 2 Plan at Layton Towns on Main - Townhomes
- 1748 N 1600 W
- 1992 W Afton Cir
- 1740 N 1600 W Unit 116
- 1596 N Main St Unit 2
- 1692 N 1600 W
- 1598 N Main St
- 1688 N 1600 W Unit 125
- 1682 N 1600 W
- 1678 N 1600 W
- 1775 W Gregory Dr
- 1738 N Gregory Dr
- 1747 N Gregory Dr
- 1768 Alfred Dr
- 1743 N Gregory Dr
- 1713 Matthew Dr
- 1739 N Gregory Dr
- 1765 Alfred Dr
- 1760 N Alfred Dr
- 1760 Alfred Dr
- 1727 N Gregory Dr
- 1753 Alfred Dr
- 1733 Matthew Dr
- 1758 W Gregory Dr
- 1736 Luke St
- 1706 N Gregory Dr
- 1746 Luke St
- 1730 Luke St
- 1713 N Gregory Dr
- 1756 Matthew Dr