Estimated Value: $118,000 - $206,000
2
Beds
--
Bath
1,280
Sq Ft
$129/Sq Ft
Est. Value
About This Home
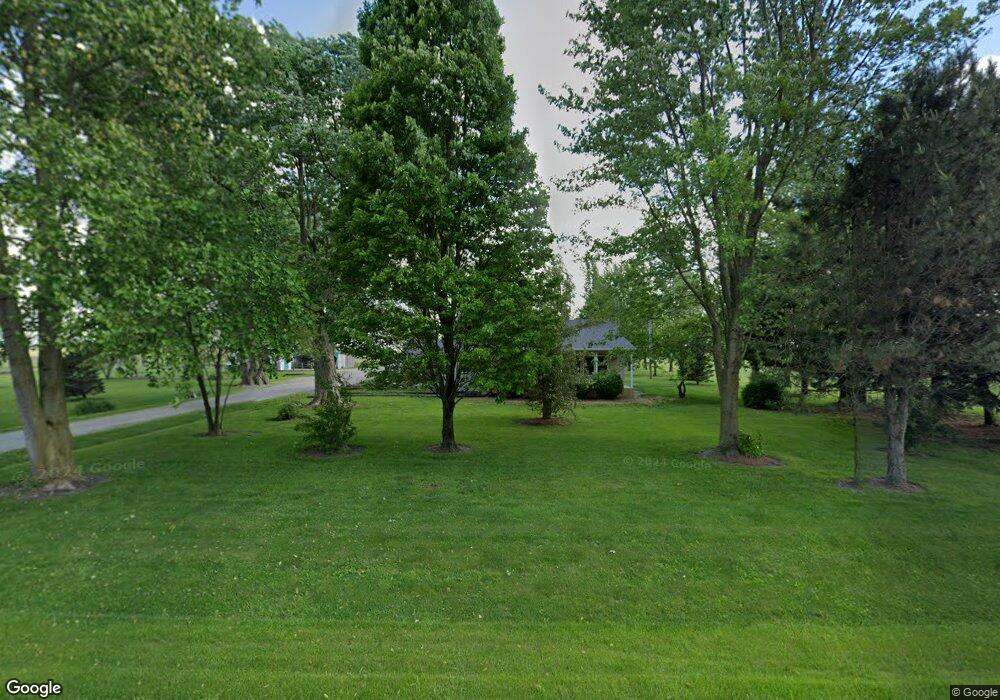
This home is located at 1772 E 350 North Rd, Pana, IL 62557 and is currently estimated at $165,595, approximately $129 per square foot. 1772 E 350 North Rd is a home located in Christian County with nearby schools including Washington Elementary School, Lincoln Elementary School, and Pana Jr High School.
Ownership History
Date
Name
Owned For
Owner Type
Purchase Details
Closed on
Aug 12, 2020
Sold by
Budds Mark L and Budds Lora A
Bought by
Harbert Evan H and Brewitt Jessica T
Current Estimated Value
Home Financials for this Owner
Home Financials are based on the most recent Mortgage that was taken out on this home.
Original Mortgage
$116,162
Outstanding Balance
$103,044
Interest Rate
3%
Mortgage Type
New Conventional
Estimated Equity
$62,551
Purchase Details
Closed on
Dec 1, 2003
Bought by
Budds Mark L and Budds Lora A
Create a Home Valuation Report for This Property
The Home Valuation Report is an in-depth analysis detailing your home's value as well as a comparison with similar homes in the area
Home Values in the Area
Average Home Value in this Area
Purchase History
| Date | Buyer | Sale Price | Title Company |
|---|---|---|---|
| Harbert Evan H | $115,000 | None Available | |
| Budds Mark L | $62,000 | -- |
Source: Public Records
Mortgage History
| Date | Status | Borrower | Loan Amount |
|---|---|---|---|
| Open | Harbert Evan H | $116,162 |
Source: Public Records
Tax History Compared to Growth
Tax History
| Year | Tax Paid | Tax Assessment Tax Assessment Total Assessment is a certain percentage of the fair market value that is determined by local assessors to be the total taxable value of land and additions on the property. | Land | Improvement |
|---|---|---|---|---|
| 2024 | $246 | $44,056 | $10,713 | $33,343 |
| 2023 | $2,413 | $42,892 | $10,510 | $32,382 |
| 2022 | $2,226 | $39,003 | $9,557 | $29,446 |
| 2021 | $2,220 | $38,333 | $9,393 | $28,940 |
| 2020 | $2,248 | $38,333 | $9,393 | $28,940 |
| 2019 | $1,841 | $32,394 | $6,842 | $25,552 |
| 2018 | $1,797 | $31,305 | $6,612 | $24,693 |
| 2017 | $1,758 | $30,553 | $6,453 | $24,100 |
| 2016 | $1,766 | $30,553 | $6,453 | $24,100 |
| 2015 | $1,607 | $27,938 | $5,874 | $22,064 |
| 2014 | $1,566 | $27,350 | $5,750 | $21,600 |
| 2013 | $1,588 | $27,350 | $5,750 | $21,600 |
| 2011 | $1,475 | $25,896 | $5,503 | $20,393 |
Source: Public Records
Map
Nearby Homes