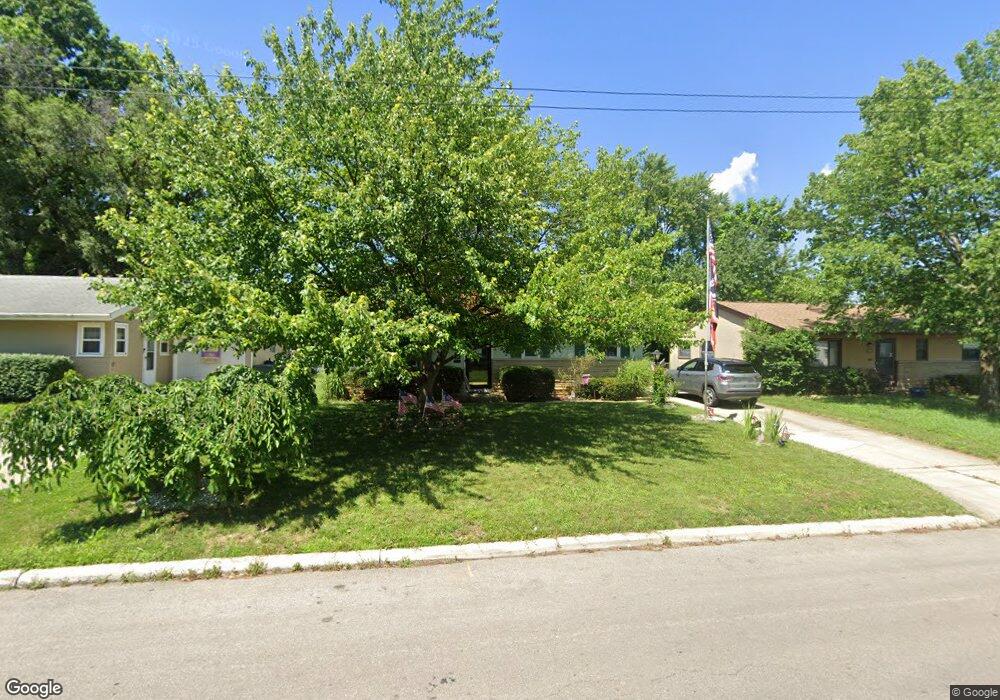
1772 Northridge Rd Columbus, OH 43224
North Linden NeighborhoodEstimated Value: $228,957 - $243,000
3
Beds
3
Baths
1,084
Sq Ft
$217/Sq Ft
Est. Value
About This Home
This home is located at 1772 Northridge Rd, Columbus, OH 43224 and is currently estimated at $235,739, approximately $217 per square foot. 1772 Northridge Rd is a home located in Franklin County with nearby schools including Huy Elementary School, Medina Middle School, and Mifflin High School.
Ownership History
Date
Name
Owned For
Owner Type
Purchase Details
Closed on
Nov 17, 2015
Sold by
Powers Thomas A and Powers Aletha A
Bought by
Powers Thomas A and Powers Aletha A
Current Estimated Value
Home Financials for this Owner
Home Financials are based on the most recent Mortgage that was taken out on this home.
Original Mortgage
$80,700
Outstanding Balance
$63,453
Interest Rate
3.78%
Mortgage Type
VA
Estimated Equity
$172,286
Purchase Details
Closed on
Jul 26, 2011
Sold by
Carnes Jane B
Bought by
Powers Thomas
Home Financials for this Owner
Home Financials are based on the most recent Mortgage that was taken out on this home.
Original Mortgage
$82,500
Interest Rate
4.54%
Mortgage Type
VA
Purchase Details
Closed on
Jun 7, 2002
Sold by
Carnes Arthur S and Carnes Jane B
Bought by
Carnes Arthur S and Carnes Jane B
Purchase Details
Closed on
Oct 18, 2001
Sold by
Carnes Arthur S and Carnes Jane B
Bought by
Carnes Arthur S and Carnes Jane B
Purchase Details
Closed on
Feb 23, 1962
Bought by
Carnes Arthur S and Carnes Jane B
Create a Home Valuation Report for This Property
The Home Valuation Report is an in-depth analysis detailing your home's value as well as a comparison with similar homes in the area
Home Values in the Area
Average Home Value in this Area
Purchase History
| Date | Buyer | Sale Price | Title Company |
|---|---|---|---|
| Powers Thomas A | -- | Chase Title | |
| Powers Thomas | -- | Title First | |
| Carnes Arthur S | -- | -- | |
| Carnes Arthur S | -- | -- | |
| Carnes Arthur S | -- | -- |
Source: Public Records
Mortgage History
| Date | Status | Borrower | Loan Amount |
|---|---|---|---|
| Open | Powers Thomas A | $80,700 | |
| Closed | Powers Thomas | $82,500 |
Source: Public Records
Tax History Compared to Growth
Tax History
| Year | Tax Paid | Tax Assessment Tax Assessment Total Assessment is a certain percentage of the fair market value that is determined by local assessors to be the total taxable value of land and additions on the property. | Land | Improvement |
|---|---|---|---|---|
| 2024 | $2,545 | $66,500 | $12,740 | $53,760 |
| 2023 | $2,540 | $66,500 | $12,740 | $53,760 |
| 2022 | $1,594 | $39,490 | $7,250 | $32,240 |
| 2021 | $1,597 | $39,490 | $7,250 | $32,240 |
| 2020 | $1,599 | $39,490 | $7,250 | $32,240 |
| 2019 | $1,323 | $30,560 | $5,780 | $24,780 |
| 2018 | $395 | $30,560 | $5,780 | $24,780 |
| 2017 | $804 | $30,560 | $5,780 | $24,780 |
| 2016 | $1,396 | $29,820 | $5,810 | $24,010 |
| 2015 | $1,267 | $29,820 | $5,810 | $24,010 |
| 2014 | $1,798 | $29,820 | $5,810 | $24,010 |
| 2013 | $934 | $31,395 | $6,125 | $25,270 |
Source: Public Records
Map
Nearby Homes
- 1905 Elmore Ave
- 3591 Bremen St
- 3583 Dresden St
- 3498 Bremen St
- 3750 Dresden St
- 3493 Bremen St
- 3462 Dresden St
- 3469 Dresden St
- 2015 Melrose Ave
- 3434 Norwood St
- 3685 Cleveland Ave
- 1507 Elmore Ave
- 3749 Ganson Dr
- 1729 Huy Rd
- 1896 Ormond Ave
- 3585 Gerbert Rd
- 3491 Ontario St
- 3471 Ontario St
- 1794 Audrey Rd
- 3519 Gerbert Rd
- 1780 Northridge Rd
- 1766 Northridge Rd
- 1758 Northridge Rd
- 1786 Northridge Rd Unit 788
- 3604 Kenlawn St
- 1795 Elmore Ave
- 1750 Northridge Rd
- 1796 Northridge Rd Unit 798
- 1796-1798 Northridge Rd Unit 798
- 1775 Elmore Ave
- 3605 Kenlawn St
- 1803 Elmore Ave
- 3596 Kenlawn St
- 3595 Greenwich St Unit 597
- 3597 Kenlawn St
- 1742 Northridge Rd
- 1804 Northridge Rd
- 0 Elmore Ave
- 1759 Elmore Ave
- 3590 Kenlawn St