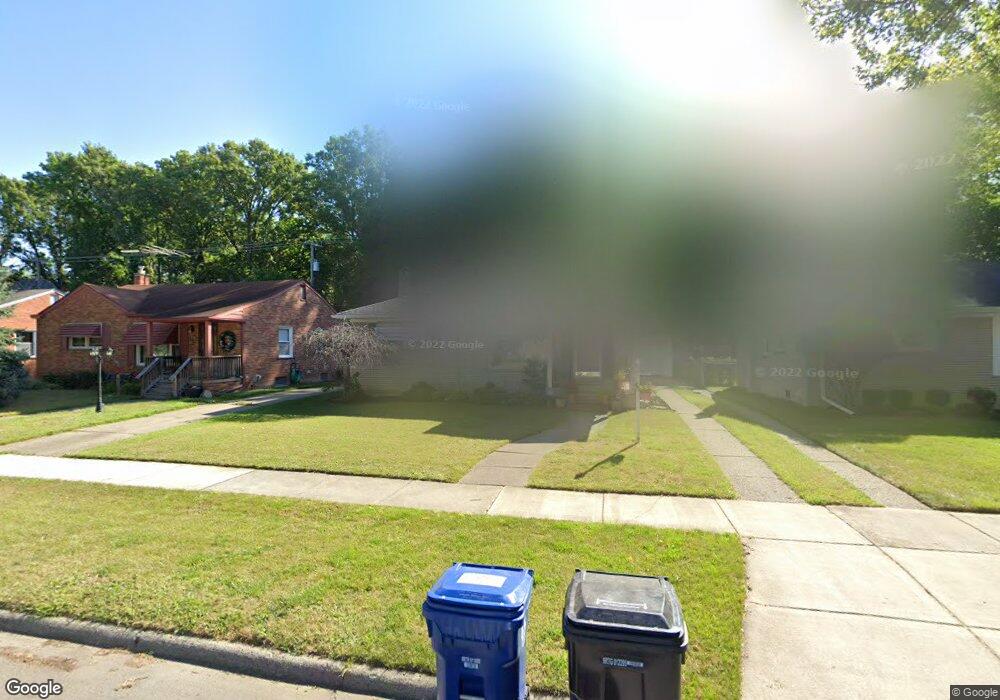
17720 Lennane Redford, MI 48240
Estimated Value: $186,000 - $212,000
3
Beds
1
Bath
1,175
Sq Ft
$164/Sq Ft
Est. Value
About This Home
This home is located at 17720 Lennane, Redford, MI 48240 and is currently estimated at $193,068, approximately $164 per square foot. 17720 Lennane is a home located in Wayne County with nearby schools including Beech Elementary School, Hilbert Middle School, and Redford Union High School.
Ownership History
Date
Name
Owned For
Owner Type
Purchase Details
Closed on
Sep 2, 2011
Sold by
Feldta Patricia and Yori Cathleen Ann
Bought by
Hardy Shanterin
Current Estimated Value
Purchase Details
Closed on
Jul 17, 2007
Sold by
Hudzik Elizabeth
Bought by
Hudzik Elizabeth
Purchase Details
Closed on
Nov 13, 1998
Sold by
Hamilton Colleen Esther
Bought by
Feldta Patricia
Home Financials for this Owner
Home Financials are based on the most recent Mortgage that was taken out on this home.
Original Mortgage
$45,349
Interest Rate
4.75%
Mortgage Type
FHA
Create a Home Valuation Report for This Property
The Home Valuation Report is an in-depth analysis detailing your home's value as well as a comparison with similar homes in the area
Home Values in the Area
Average Home Value in this Area
Purchase History
| Date | Buyer | Sale Price | Title Company |
|---|---|---|---|
| Hardy Shanterin | $46,529 | Capital Title Ins Agency | |
| Hudzik Elizabeth | -- | None Available | |
| Feldta Patricia | -- | Capital Title Ins Agency |
Source: Public Records
Mortgage History
| Date | Status | Borrower | Loan Amount |
|---|---|---|---|
| Previous Owner | Feldta Patricia | $45,349 |
Source: Public Records
Tax History Compared to Growth
Tax History
| Year | Tax Paid | Tax Assessment Tax Assessment Total Assessment is a certain percentage of the fair market value that is determined by local assessors to be the total taxable value of land and additions on the property. | Land | Improvement |
|---|---|---|---|---|
| 2025 | $930 | $93,500 | $0 | $0 |
| 2024 | $930 | $84,500 | $0 | $0 |
| 2023 | $887 | $74,200 | $0 | $0 |
| 2022 | $2,184 | $66,600 | $0 | $0 |
| 2021 | $2,052 | $61,300 | $0 | $0 |
| 2020 | $2,024 | $52,200 | $0 | $0 |
| 2019 | $1,980 | $45,400 | $0 | $0 |
| 2018 | $770 | $34,600 | $0 | $0 |
| 2017 | $2,399 | $34,000 | $0 | $0 |
| 2016 | $1,964 | $33,400 | $0 | $0 |
| 2015 | $2,766 | $31,100 | $0 | $0 |
| 2013 | $2,680 | $27,300 | $0 | $0 |
| 2012 | $1,865 | $31,600 | $8,100 | $23,500 |
Source: Public Records
Map
Nearby Homes