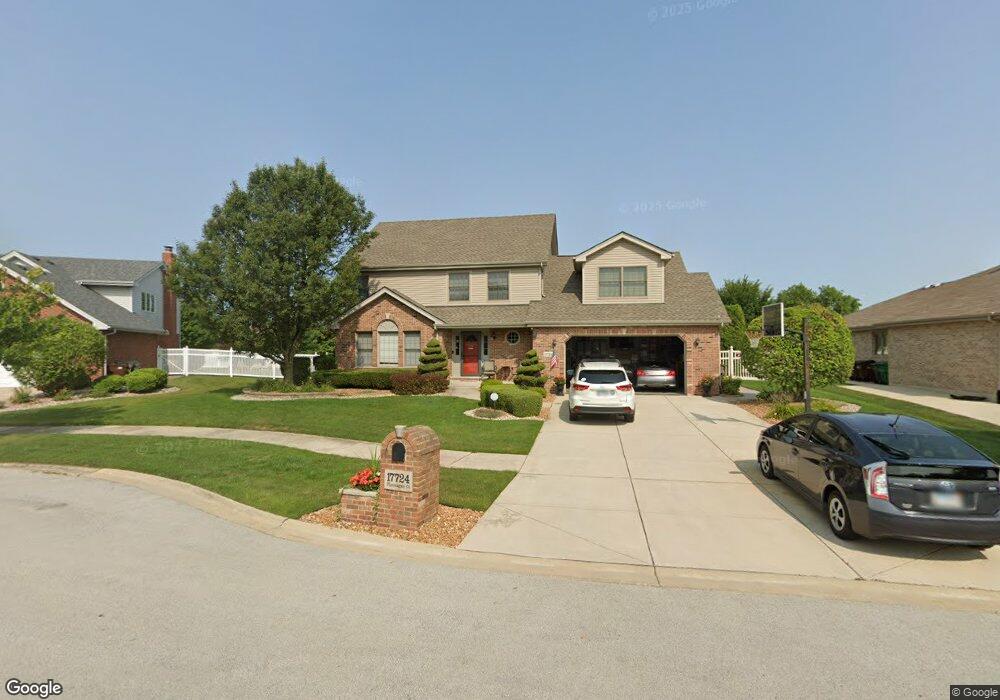
17724 Flannagan Ct Tinley Park, IL 60487
Central Tinley Park NeighborhoodEstimated Value: $509,588 - $591,000
4
Beds
3
Baths
2,626
Sq Ft
$209/Sq Ft
Est. Value
About This Home
This home is located at 17724 Flannagan Ct, Tinley Park, IL 60487 and is currently estimated at $547,647, approximately $208 per square foot. 17724 Flannagan Ct is a home located in Cook County with nearby schools including Millennium Elementary School, Prairie View Middle School, and Victor J Andrew High School.
Ownership History
Date
Name
Owned For
Owner Type
Purchase Details
Closed on
Nov 7, 2003
Sold by
Standard Bank & Trust Co
Bought by
Stanley John M and Stanley Lisa A
Current Estimated Value
Home Financials for this Owner
Home Financials are based on the most recent Mortgage that was taken out on this home.
Original Mortgage
$252,000
Interest Rate
5.91%
Mortgage Type
Unknown
Create a Home Valuation Report for This Property
The Home Valuation Report is an in-depth analysis detailing your home's value as well as a comparison with similar homes in the area
Home Values in the Area
Average Home Value in this Area
Purchase History
| Date | Buyer | Sale Price | Title Company |
|---|---|---|---|
| Stanley John M | $318,500 | Cti |
Source: Public Records
Mortgage History
| Date | Status | Borrower | Loan Amount |
|---|---|---|---|
| Previous Owner | Stanley John M | $252,000 | |
| Closed | Stanley John M | $32,000 |
Source: Public Records
Tax History Compared to Growth
Tax History
| Year | Tax Paid | Tax Assessment Tax Assessment Total Assessment is a certain percentage of the fair market value that is determined by local assessors to be the total taxable value of land and additions on the property. | Land | Improvement |
|---|---|---|---|---|
| 2024 | $10,272 | $40,311 | $5,963 | $34,348 |
| 2023 | $9,579 | $40,311 | $5,963 | $34,348 |
| 2022 | $9,579 | $30,291 | $5,185 | $25,106 |
| 2021 | $9,302 | $30,290 | $5,185 | $25,105 |
| 2020 | $10,055 | $33,021 | $5,185 | $27,836 |
| 2019 | $8,904 | $30,883 | $4,666 | $26,217 |
| 2018 | $8,711 | $30,883 | $4,666 | $26,217 |
| 2017 | $8,498 | $30,883 | $4,666 | $26,217 |
| 2016 | $8,284 | $27,441 | $4,148 | $23,293 |
| 2015 | $8,154 | $27,441 | $4,148 | $23,293 |
| 2014 | $8,102 | $27,441 | $4,148 | $23,293 |
| 2013 | $8,754 | $31,616 | $4,148 | $27,468 |
Source: Public Records
Map
Nearby Homes
- 17631 Dover Ct
- 8530 Radcliffe Rd
- Eden Plan at Radcliffe Place
- Fremont Plan at Radcliffe Place
- Danbury Plan at Radcliffe Place
- Calysta Plan at Radcliffe Place
- Briarcliffe Plan at Radcliffe Place
- Amberwood Plan at Radcliffe Place
- 17418 Avon Ln
- 17533 Pecan Ln
- 17324 Humber Ln
- 8543 Carriage Ln
- 8416 Stratford Dr Unit 8416
- 8423 Stratford Dr Unit 8423
- 17594 Windsor Pkwy Unit 58
- 9201 175th St
- 17230 Shetland Dr
- 18261 Kirby Dr Unit 2918261
- 9280 Windsor Pkwy Unit 92
- 17800 Iroquois Trace
- 17718 Flannagan Ct Unit 4
- 17730 Flannagan Ct Unit 4
- 17736 Flannagan Ct
- 17712 Flannagan Ct
- 8803 Clifton Ln
- 17719 Flannagan Ct
- 17725 Flannagan Ct
- 17731 Flannagan Ct
- 8800 178th St
- 8711 Radcliffe Rd
- 8800 Clifton Ln
- 8736 Moss Ct
- 8730 Moss Ct
- 8809 Clifton Ln
- 8809 Clifton Ln
- 17730 Westbridge Rd
- 8724 Moss Ct
- 8806 Clifton Ln
- 8701 Radcliffe Rd
- 17800 Westbridge Rd