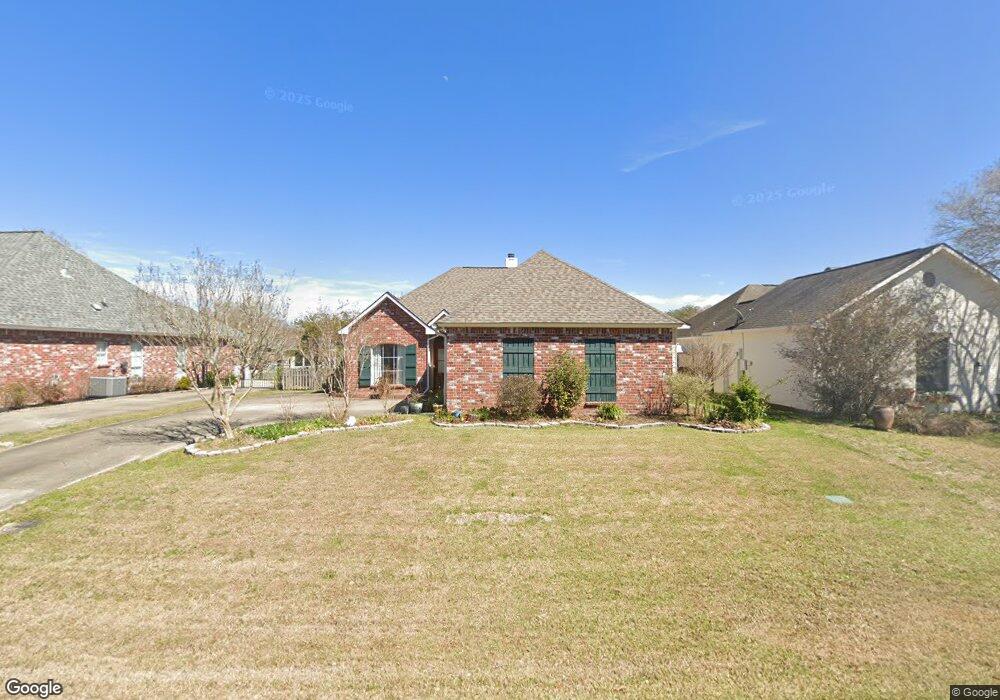
17728 Lake Azalea Dr Baton Rouge, LA 70817
Estimated Value: $256,000 - $290,000
3
Beds
2
Baths
1,650
Sq Ft
$166/Sq Ft
Est. Value
About This Home
This home is located at 17728 Lake Azalea Dr, Baton Rouge, LA 70817 and is currently estimated at $273,162, approximately $165 per square foot. 17728 Lake Azalea Dr is a home located in East Baton Rouge Parish with nearby schools including Woodlawn Elementary School, Woodlawn Middle School, and Woodlawn High School.
Ownership History
Date
Name
Owned For
Owner Type
Purchase Details
Closed on
May 1, 2000
Sold by
Goodson Mark T
Bought by
Youngblood Mary L
Current Estimated Value
Home Financials for this Owner
Home Financials are based on the most recent Mortgage that was taken out on this home.
Original Mortgage
$62,000
Outstanding Balance
$21,203
Interest Rate
8%
Estimated Equity
$251,959
Purchase Details
Closed on
Oct 12, 1998
Sold by
Tri Star Builders Llc
Bought by
Goodson Mark T and Goodson Stacie L
Home Financials for this Owner
Home Financials are based on the most recent Mortgage that was taken out on this home.
Original Mortgage
$126,250
Interest Rate
6.92%
Purchase Details
Closed on
May 11, 1998
Sold by
Azalea Lakes Partnership
Bought by
Tri Star Builders Llc
Home Financials for this Owner
Home Financials are based on the most recent Mortgage that was taken out on this home.
Original Mortgage
$500,000
Interest Rate
7.09%
Mortgage Type
Purchase Money Mortgage
Create a Home Valuation Report for This Property
The Home Valuation Report is an in-depth analysis detailing your home's value as well as a comparison with similar homes in the area
Home Values in the Area
Average Home Value in this Area
Purchase History
| Date | Buyer | Sale Price | Title Company |
|---|---|---|---|
| Youngblood Mary L | $134,900 | -- | |
| Goodson Mark T | $132,900 | -- | |
| Tri Star Builders Llc | $27,900 | -- |
Source: Public Records
Mortgage History
| Date | Status | Borrower | Loan Amount |
|---|---|---|---|
| Open | Youngblood Mary L | $62,000 | |
| Previous Owner | Goodson Mark T | $126,250 | |
| Previous Owner | Tri Star Builders Llc | $500,000 |
Source: Public Records
Tax History Compared to Growth
Tax History
| Year | Tax Paid | Tax Assessment Tax Assessment Total Assessment is a certain percentage of the fair market value that is determined by local assessors to be the total taxable value of land and additions on the property. | Land | Improvement |
|---|---|---|---|---|
| 2024 | $720 | $13,500 | $4,000 | $9,500 |
| 2023 | $720 | $13,500 | $4,000 | $9,500 |
| 2022 | $1,546 | $13,500 | $4,000 | $9,500 |
| 2021 | $1,517 | $13,500 | $4,000 | $9,500 |
| 2020 | $1,536 | $13,500 | $4,000 | $9,500 |
| 2019 | $1,598 | $13,500 | $4,000 | $9,500 |
| 2018 | $1,578 | $13,500 | $4,000 | $9,500 |
| 2017 | $1,578 | $13,500 | $4,000 | $9,500 |
| 2016 | $330 | $10,175 | $4,000 | $6,175 |
| 2015 | $701 | $13,500 | $4,000 | $9,500 |
| 2014 | $687 | $13,500 | $4,000 | $9,500 |
| 2013 | -- | $13,500 | $4,000 | $9,500 |
Source: Public Records
Map
Nearby Homes
- 17647 Lake Azalea Dr
- 18733 W Lake Terrace Dr
- 18514 Hoo Shoo Too Rd
- 18728 Hoo Shoo Too Rd
- 17662 Doc Bar Ave
- 18421 Lake Iris Ave
- 18532 Garden Oaks Dr
- 18406 Jefferson Hwy
- 17715 Azalea Lakes Ave
- 9832 Vignes Lake Ave
- 17526 Comfort Blvd
- 10921 Grace Ln
- 10104 Clarks Ferry Dr
- 10606 Grace Ln
- 10727 Grace Ln
- 17741 La Grange Ct
- 18953 Vignes Lake Ave
- 11351 Moultrie Ave
- 18238 Woodland Cove Dr
- 17843 Willow Trail Dr
- 17718 Lake Azalea Dr
- 17735 Azalea Lake
- 0 Lake Azalea Dr
- 17686 Lake Azalea Dr
- 17748 Lake Azalea Dr
- 18927 W Lake Terrace Dr
- 18937 W Lake Terrace Dr
- 18917 W Lake Terrace Dr
- 17676 Lake Azalea Dr
- 17729 Lake Azalea Dr
- 17739 Lake Azalea Dr
- 17719 Lake Azalea Dr
- 17749 Lake Azalea Dr
- 17677 Lake Azalea Dr
- 18855 W Lake Terrace Dr
- 18957 W Lake Terrace Dr
- 17759 Lake Azalea Dr
- 17667 Lake Azalea Dr
- 18845 W Lake Terrace Dr
- 19009 W Lake Terrace Dr