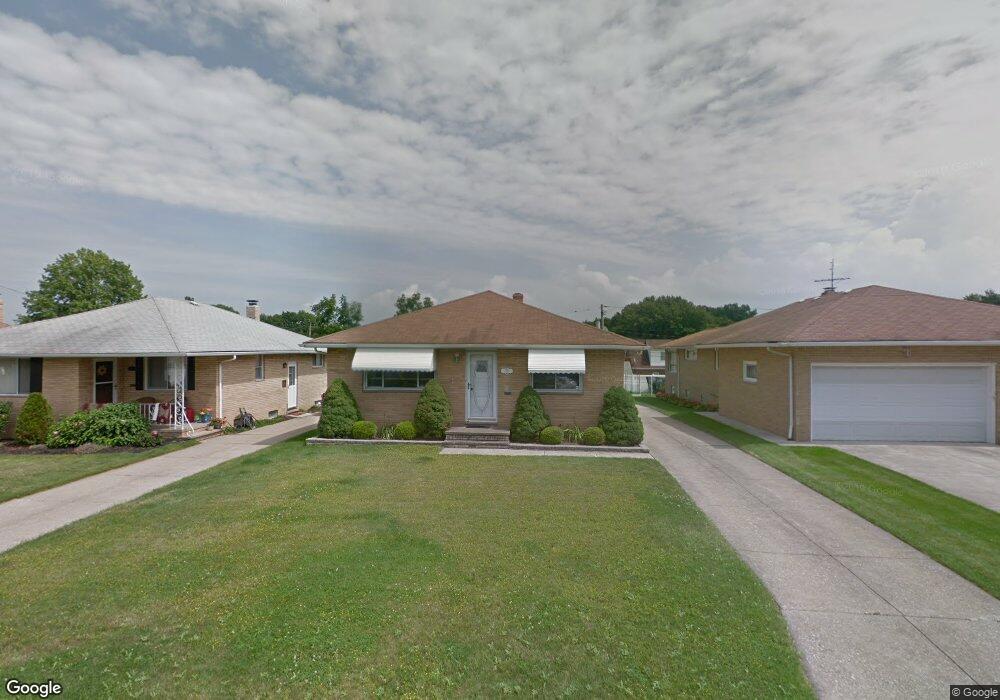
1773 Spino Dr Euclid, OH 44117
Estimated Value: $157,000 - $192,000
2
Beds
2
Baths
1,200
Sq Ft
$146/Sq Ft
Est. Value
About This Home
This home is located at 1773 Spino Dr, Euclid, OH 44117 and is currently estimated at $174,630, approximately $145 per square foot. 1773 Spino Dr is a home located in Cuyahoga County with nearby schools including Thomas Jefferson Elementary School, Euclid Middle School, and Euclid High School.
Ownership History
Date
Name
Owned For
Owner Type
Purchase Details
Closed on
Mar 23, 2005
Sold by
Hixenbaugh Fred A and Hixenbagh Henrietta C
Bought by
Hixenbaugh Velia A
Current Estimated Value
Home Financials for this Owner
Home Financials are based on the most recent Mortgage that was taken out on this home.
Original Mortgage
$132,914
Outstanding Balance
$67,384
Interest Rate
5.61%
Mortgage Type
FHA
Estimated Equity
$107,246
Purchase Details
Closed on
Nov 27, 1998
Sold by
Perovsek Thomas A
Bought by
Hixenbaugh Fred A and Hixenbaugh Henrietta C
Purchase Details
Closed on
Aug 21, 1991
Sold by
Strammer Theresia
Bought by
Perovsek Thomas A
Purchase Details
Closed on
Jan 23, 1986
Sold by
Strammer Theresia
Bought by
Strammer Theresia
Purchase Details
Closed on
Jan 8, 1986
Sold by
Strammer John and Strammer Theresia
Bought by
Strammer Theresia
Purchase Details
Closed on
Jan 1, 1975
Bought by
Strammer John and Strammer Theresia
Create a Home Valuation Report for This Property
The Home Valuation Report is an in-depth analysis detailing your home's value as well as a comparison with similar homes in the area
Home Values in the Area
Average Home Value in this Area
Purchase History
| Date | Buyer | Sale Price | Title Company |
|---|---|---|---|
| Hixenbaugh Velia A | $135,000 | Title Xperts Agency Inc | |
| Hixenbaugh Fred A | $102,500 | Executive Title Agency Corp | |
| Perovsek Thomas A | $84,000 | -- | |
| Strammer Theresia | -- | -- | |
| Strammer Theresia | -- | -- | |
| Strammer John | -- | -- |
Source: Public Records
Mortgage History
| Date | Status | Borrower | Loan Amount |
|---|---|---|---|
| Open | Hixenbaugh Velia A | $132,914 |
Source: Public Records
Tax History
| Year | Tax Paid | Tax Assessment Tax Assessment Total Assessment is a certain percentage of the fair market value that is determined by local assessors to be the total taxable value of land and additions on the property. | Land | Improvement |
|---|---|---|---|---|
| 2024 | $3,867 | $56,665 | $9,205 | $47,460 |
| 2023 | $3,198 | $37,140 | $7,180 | $29,960 |
| 2022 | $3,125 | $37,140 | $7,180 | $29,960 |
| 2021 | $3,483 | $37,140 | $7,180 | $29,960 |
| 2020 | $3,303 | $32,030 | $6,200 | $25,830 |
| 2019 | $2,971 | $91,500 | $17,700 | $73,800 |
| 2018 | $3,001 | $32,030 | $6,200 | $25,830 |
| 2017 | $3,212 | $28,670 | $4,970 | $23,700 |
| 2016 | $3,220 | $28,670 | $4,970 | $23,700 |
| 2015 | $2,929 | $28,670 | $4,970 | $23,700 |
| 2014 | $2,929 | $28,670 | $4,970 | $23,700 |
Source: Public Records
Map
Nearby Homes
- 1754 E 236th St
- 23501 Effingham Blvd
- 1765 E 238th St
- 21950 Euclid Ave
- 1775 Sherwood Blvd
- 24105 Chardon Rd
- 1554 E 221st St
- 1545 E 214th St
- 22791 Harms Rd
- 22601 Harms Rd
- 363 Balmoral Dr
- 1734 Glenridge Rd
- 1732 Glenridge Rd
- 24 Washington Square Unit 15
- 20021 Green Oak Dr
- 1934 Beverly Hills Dr
- 25031 Glenbrook Blvd
- 1524 E 204th St
- 1721 Grand Blvd
- 209 Greenbriar Ct
- 1777 Spino Dr
- 1769 Spino Dr
- 1781 Spino Dr
- 1765 Spino Dr
- 1764 E 230th St
- 1785 Spino Dr
- 1761 Spino Dr
- 1770 E 230th St
- 1754 E 230th St
- 1774 E 230th St
- 1750 E 230th St
- 1755 Spino Dr
- 1787 Spino Dr
- 1780 E 230th St
- 1845 E 227th St
- 1841 E 227th St
- 1851 E 227th St
- 1831 E 227th St
- 1744 E 230th St
- 1791 Spino Dr
Your Personal Tour Guide
Ask me questions while you tour the home.