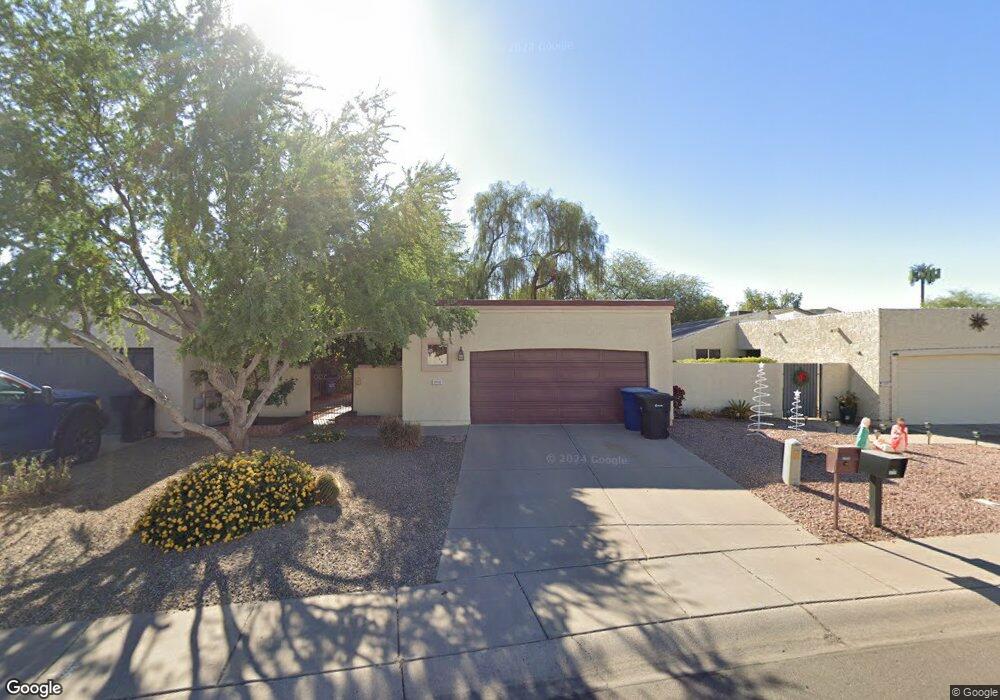
1773 W El Monte Place Chandler, AZ 85224
Amberwood NeighborhoodEstimated Value: $323,245 - $464,000
--
Bed
2
Baths
1,326
Sq Ft
$302/Sq Ft
Est. Value
About This Home
This home is located at 1773 W El Monte Place, Chandler, AZ 85224 and is currently estimated at $400,561, approximately $302 per square foot. 1773 W El Monte Place is a home located in Maricopa County with nearby schools including Pomeroy Elementary School, Franklin at Brimhall Elementary School, and Summit Academy Elementary.
Ownership History
Date
Name
Owned For
Owner Type
Purchase Details
Closed on
Dec 27, 2012
Sold by
Yeager Sheila A
Bought by
Yeager Sheila A and The Sheila A Yeager Revocable Living Tru
Current Estimated Value
Purchase Details
Closed on
Oct 2, 1997
Sold by
Griego Mona T
Bought by
Yeager Albert W and Yeager Sheila A
Home Financials for this Owner
Home Financials are based on the most recent Mortgage that was taken out on this home.
Original Mortgage
$50,000
Outstanding Balance
$8,061
Interest Rate
7.49%
Mortgage Type
New Conventional
Estimated Equity
$392,500
Purchase Details
Closed on
May 29, 1996
Sold by
Cox Herbert Eugene and Cox Ruth Adelaide
Bought by
Griego Mona T
Home Financials for this Owner
Home Financials are based on the most recent Mortgage that was taken out on this home.
Original Mortgage
$70,400
Interest Rate
8.09%
Mortgage Type
New Conventional
Create a Home Valuation Report for This Property
The Home Valuation Report is an in-depth analysis detailing your home's value as well as a comparison with similar homes in the area
Home Values in the Area
Average Home Value in this Area
Purchase History
| Date | Buyer | Sale Price | Title Company |
|---|---|---|---|
| Yeager Sheila A | -- | None Available | |
| Yeager Albert W | $94,900 | First American Title | |
| Griego Mona T | $88,000 | United Title Agency |
Source: Public Records
Mortgage History
| Date | Status | Borrower | Loan Amount |
|---|---|---|---|
| Open | Yeager Albert W | $50,000 | |
| Previous Owner | Griego Mona T | $70,400 |
Source: Public Records
Tax History Compared to Growth
Tax History
| Year | Tax Paid | Tax Assessment Tax Assessment Total Assessment is a certain percentage of the fair market value that is determined by local assessors to be the total taxable value of land and additions on the property. | Land | Improvement |
|---|---|---|---|---|
| 2025 | $1,280 | $15,014 | -- | -- |
| 2024 | $1,292 | $14,299 | -- | -- |
| 2023 | $1,292 | $30,530 | $6,100 | $24,430 |
| 2022 | $1,257 | $22,130 | $4,420 | $17,710 |
| 2021 | $1,264 | $20,030 | $4,000 | $16,030 |
| 2020 | $1,250 | $18,620 | $3,720 | $14,900 |
| 2019 | $1,151 | $16,160 | $3,230 | $12,930 |
| 2018 | $1,118 | $15,670 | $3,130 | $12,540 |
| 2017 | $1,075 | $14,170 | $2,830 | $11,340 |
| 2016 | $1,051 | $14,280 | $2,850 | $11,430 |
| 2015 | $989 | $14,750 | $2,950 | $11,800 |
Source: Public Records
Map
Nearby Homes
- 2129 N Villas Ln
- 1771 W Mariposa Ct
- 2103 W Palomino Dr
- 2015 N Villas Ln
- 2104 N Pennington Dr
- 1704 W Rosal Dr
- 1511 W Mesquite St
- 2210 N Los Altos Dr
- 2100 W Lemon Tree Place Unit 68
- 2100 W Lemon Tree Place Unit 29
- 2100 W Lemon Tree Place Unit 78
- 1821 W Mission Dr
- 2029 W Shawnee Dr
- 1807 W Mission Dr
- 1417 W Los Arboles Place
- 1719 N Cholla St
- 2615 N Yucca St
- 1805 W Cheyenne Dr
- 1403 W Los Arboles Place
- 1645 N Saguaro St
- 1769 W El Monte Place
- 1777 W El Monte Place
- 1774 W Colt Rd
- 1803 W El Monte Place
- 1770 W Colt Rd
- 1807 W El Monte Place
- 2120 N College Ct
- 2124 N College Ct
- 1811 W El Monte Place
- 1775 W Colt Rd
- 1762 W Colt Rd
- 2128 N College Ct
- 2119 N College Ct
- 1815 W El Monte Place
- 1771 W Colt Rd
- 2121 N Apollo Ct
- 1758 W Colt Rd
- 2123 N College Ct
- 2045 N Dobson Rd Unit 1A
- 2045 N Dobson Rd Unit 1C