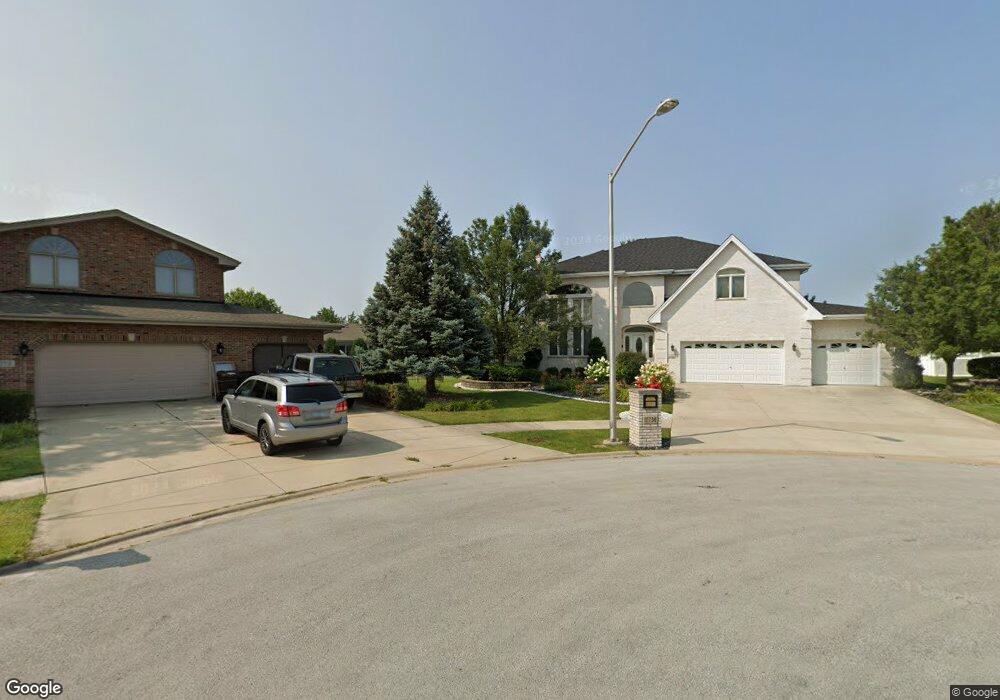
17736 Flannagan Ct Tinley Park, IL 60487
Central Tinley Park NeighborhoodEstimated Value: $590,248 - $615,000
5
Beds
3
Baths
3,588
Sq Ft
$167/Sq Ft
Est. Value
About This Home
This home is located at 17736 Flannagan Ct, Tinley Park, IL 60487 and is currently estimated at $600,312, approximately $167 per square foot. 17736 Flannagan Ct is a home located in Cook County with nearby schools including Millennium Elementary School, Prairie View Middle School, and Victor J Andrew High School.
Ownership History
Date
Name
Owned For
Owner Type
Purchase Details
Closed on
May 17, 2017
Sold by
Pnc Bank Na
Bought by
Aina Chris A and Aina Olajumoke O
Current Estimated Value
Home Financials for this Owner
Home Financials are based on the most recent Mortgage that was taken out on this home.
Original Mortgage
$350,533
Outstanding Balance
$289,654
Interest Rate
3.87%
Mortgage Type
FHA
Estimated Equity
$310,658
Purchase Details
Closed on
Feb 6, 2017
Sold by
Idrovo Bianca
Bought by
Pnc Bank Na
Purchase Details
Closed on
Aug 18, 2004
Sold by
Idrovo Richard W
Bought by
Idrovo Ignatius and Idrovo Richard W
Purchase Details
Closed on
Nov 7, 2003
Sold by
Standard Bank & Trust Co
Bought by
Idrovo Richard W
Home Financials for this Owner
Home Financials are based on the most recent Mortgage that was taken out on this home.
Original Mortgage
$393,307
Interest Rate
5.37%
Mortgage Type
Unknown
Create a Home Valuation Report for This Property
The Home Valuation Report is an in-depth analysis detailing your home's value as well as a comparison with similar homes in the area
Home Values in the Area
Average Home Value in this Area
Purchase History
| Date | Buyer | Sale Price | Title Company |
|---|---|---|---|
| Aina Chris A | -- | Premier Title | |
| Pnc Bank Na | -- | Premier Title | |
| Idrovo Ignatius | -- | -- | |
| Idrovo Richard W | -- | Cti |
Source: Public Records
Mortgage History
| Date | Status | Borrower | Loan Amount |
|---|---|---|---|
| Open | Aina Chris A | $350,533 | |
| Previous Owner | Idrovo Richard W | $393,307 |
Source: Public Records
Tax History Compared to Growth
Tax History
| Year | Tax Paid | Tax Assessment Tax Assessment Total Assessment is a certain percentage of the fair market value that is determined by local assessors to be the total taxable value of land and additions on the property. | Land | Improvement |
|---|---|---|---|---|
| 2024 | $12,684 | $49,000 | $5,950 | $43,050 |
| 2023 | $11,665 | $49,000 | $5,950 | $43,050 |
| 2022 | $11,665 | $36,142 | $5,174 | $30,968 |
| 2021 | $11,321 | $36,140 | $5,173 | $30,967 |
| 2020 | $11,103 | $36,140 | $5,173 | $30,967 |
| 2019 | $11,929 | $40,210 | $4,656 | $35,554 |
| 2018 | $12,762 | $40,210 | $4,656 | $35,554 |
| 2017 | $11,379 | $40,210 | $4,656 | $35,554 |
| 2016 | $11,629 | $37,512 | $4,138 | $33,374 |
| 2015 | $11,464 | $37,512 | $4,138 | $33,374 |
| 2014 | $11,383 | $37,512 | $4,138 | $33,374 |
| 2013 | $12,023 | $42,437 | $4,138 | $38,299 |
Source: Public Records
Map
Nearby Homes
- 17631 Dover Ct
- 8530 Radcliffe Rd
- Eden Plan at Radcliffe Place
- Fremont Plan at Radcliffe Place
- Danbury Plan at Radcliffe Place
- Calysta Plan at Radcliffe Place
- Briarcliffe Plan at Radcliffe Place
- Amberwood Plan at Radcliffe Place
- 17418 Avon Ln
- 17533 Pecan Ln
- 17324 Humber Ln
- 8416 Stratford Dr Unit 8416
- 8423 Stratford Dr Unit 8423
- 17594 Windsor Pkwy Unit 58
- 18261 Kirby Dr Unit 2918261
- 9201 175th St
- 8543 Carriage Ln
- 9058 Newcastle Ct
- 9280 Windsor Pkwy Unit 92
- 9313 178th St
- 17730 Flannagan Ct Unit 4
- 8730 Moss Ct
- 8736 Moss Ct
- 17731 Flannagan Ct
- 17724 Flannagan Ct
- 8724 Moss Ct
- 17725 Flannagan Ct
- 8742 Moss Ct
- 17718 Flannagan Ct Unit 4
- 8800 178th St
- 17719 Flannagan Ct
- 17812 Westbridge Rd
- 8803 Clifton Ln
- 17806 Westbridge Rd
- 17800 Westbridge Rd
- 8801 178th St
- 17712 Flannagan Ct
- 17730 Westbridge Rd
- 8711 Radcliffe Rd
- 8725 Moss Ct