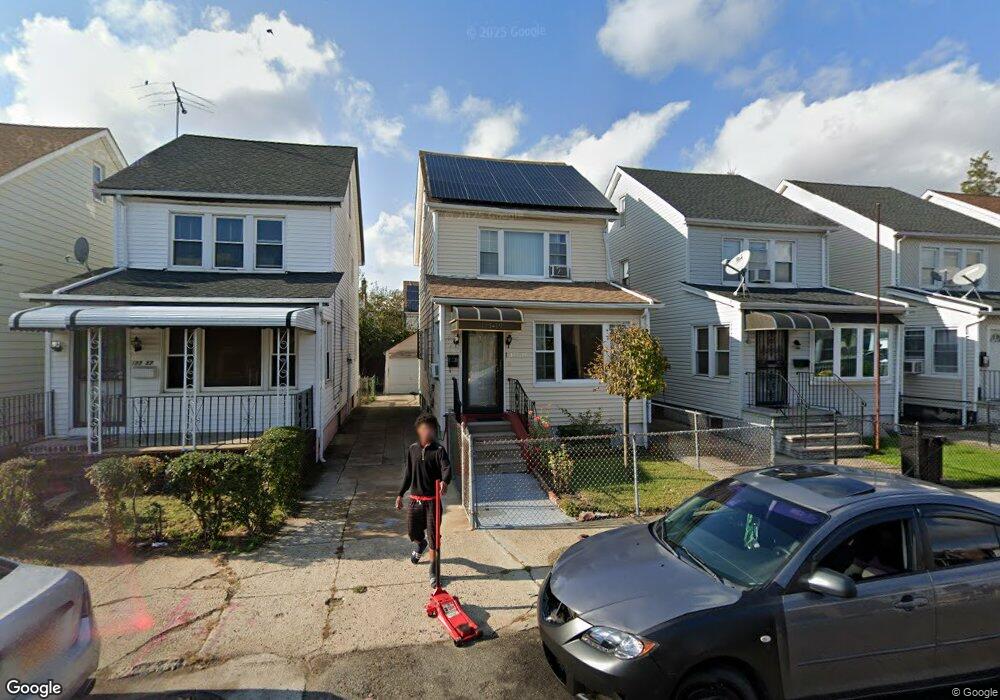
17739 Troutville Rd Jamaica, NY 11434
Saint Albans NeighborhoodEstimated Value: $600,122 - $734,000
--
Bed
--
Bath
1,328
Sq Ft
$507/Sq Ft
Est. Value
About This Home
This home is located at 17739 Troutville Rd, Jamaica, NY 11434 and is currently estimated at $673,781, approximately $507 per square foot. 17739 Troutville Rd is a home located in Queens County with nearby schools including The Jermaine L. Green STEM Institute of Queens, Catherine & Count Basie Middle School 72, and Rochdale Early Advantage Charter School.
Ownership History
Date
Name
Owned For
Owner Type
Purchase Details
Closed on
Jul 30, 2004
Sold by
Miller Naomi and Pantry Desmond
Bought by
Pantry Andrew D and Pantry Desmond
Current Estimated Value
Purchase Details
Closed on
Jun 10, 1999
Sold by
Progress Equities Inc
Bought by
Pantry Desmond and Miller Naomi
Home Financials for this Owner
Home Financials are based on the most recent Mortgage that was taken out on this home.
Original Mortgage
$195,250
Outstanding Balance
$51,076
Interest Rate
7.19%
Mortgage Type
FHA
Estimated Equity
$622,705
Purchase Details
Closed on
Jan 29, 1999
Sold by
Judd Victor and Judd Ena
Bought by
Progress Equities Inc
Create a Home Valuation Report for This Property
The Home Valuation Report is an in-depth analysis detailing your home's value as well as a comparison with similar homes in the area
Home Values in the Area
Average Home Value in this Area
Purchase History
| Date | Buyer | Sale Price | Title Company |
|---|---|---|---|
| Pantry Andrew D | -- | -- | |
| Pantry Andrew D | -- | -- | |
| Pantry Desmond | $197,000 | -- | |
| Pantry Desmond | $197,000 | -- | |
| Progress Equities Inc | $125,000 | Chicago Title Insurance Co | |
| Progress Equities Inc | $125,000 | Chicago Title Insurance Co |
Source: Public Records
Mortgage History
| Date | Status | Borrower | Loan Amount |
|---|---|---|---|
| Open | Pantry Desmond | $195,250 | |
| Closed | Pantry Desmond | $195,250 |
Source: Public Records
Tax History Compared to Growth
Tax History
| Year | Tax Paid | Tax Assessment Tax Assessment Total Assessment is a certain percentage of the fair market value that is determined by local assessors to be the total taxable value of land and additions on the property. | Land | Improvement |
|---|---|---|---|---|
| 2025 | $4,786 | $26,742 | $7,031 | $19,711 |
| 2024 | $4,798 | $25,229 | $7,836 | $17,393 |
| 2023 | $4,516 | $23,886 | $7,187 | $16,699 |
| 2022 | $3,093 | $32,160 | $10,380 | $21,780 |
| 2021 | $3,331 | $32,640 | $10,380 | $22,260 |
| 2020 | $3,231 | $35,880 | $10,380 | $25,500 |
| 2019 | $2,915 | $30,720 | $10,380 | $20,340 |
| 2018 | $3,760 | $19,905 | $5,896 | $14,009 |
| 2017 | $3,589 | $19,076 | $7,747 | $11,329 |
| 2016 | $3,504 | $19,076 | $7,747 | $11,329 |
| 2015 | $1,951 | $18,571 | $10,187 | $8,384 |
| 2014 | $1,951 | $17,520 | $11,520 | $6,000 |
Source: Public Records
Map
Nearby Homes
- 17715 Troutville Rd
- 17710 Troutville Rd
- 176-27 Sunbury Rd
- 174-41 125th Ave
- 12126 Irwin Place
- 176-43 120th Ave
- 17720 Leslie Rd
- 119-60 177th St
- 173-33 Vaswani Ave
- 119-72 178th St
- 178-20 Selover Rd
- 11984 178th Place
- 17918 Selover Rd
- 119-48 178th St
- 174-63 128th Ave
- 119-73 Merrill St
- 172-40 125th Ave
- 172-38 Brocher Rd
- 179-01 120th Ave
- 17955 Anderson Rd
- 177-41 Troutville Rd
- 17737 Troutville Rd
- 17741 Troutville Rd
- 17735 Troutville Rd
- 17745 Troutville Rd
- 177-47 Troutville Rd
- 17731 Troutville Rd
- 17747 Troutville Rd
- 17642 Sunbury Rd
- 17640 Sunbury Rd
- 177-29 Troutville Rd
- 17646 Sunbury Rd
- 17729 Troutville Rd
- 17749 Troutville Rd
- 17749 Troutville Rd
- 17636 Sunbury Rd
- 17648 Sunbury Rd
- 17636 Sunbury Rd
- 17636 Sunbury Rd
- 17634 Sunbury Rd