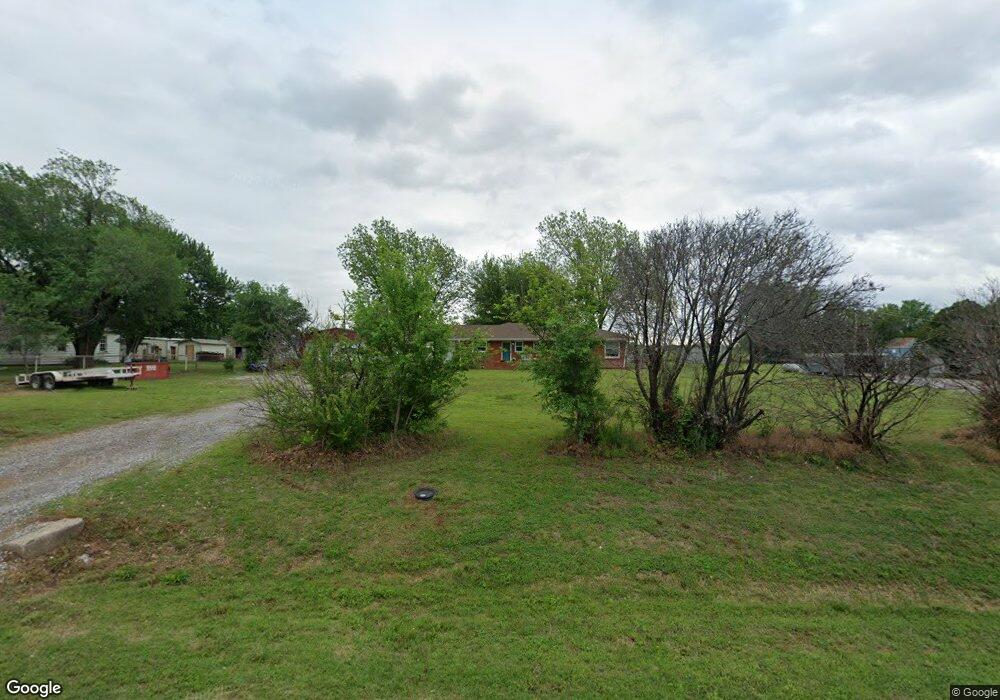
177390 N 2820 Rd Duncan, OK 73533
Estimated Value: $136,964 - $244,000
3
Beds
2
Baths
1,395
Sq Ft
$129/Sq Ft
Est. Value
About This Home
This home is located at 177390 N 2820 Rd, Duncan, OK 73533 and is currently estimated at $179,491, approximately $128 per square foot. 177390 N 2820 Rd is a home located in Stephens County with nearby schools including Comanche Elementary School, Comanche Middle School, and Comanche High School.
Ownership History
Date
Name
Owned For
Owner Type
Purchase Details
Closed on
Jan 23, 2020
Sold by
Clanahan Holten N
Bought by
Shaw Brian C and Shaw Kristen L
Current Estimated Value
Home Financials for this Owner
Home Financials are based on the most recent Mortgage that was taken out on this home.
Original Mortgage
$108,498
Outstanding Balance
$97,870
Interest Rate
4.75%
Mortgage Type
FHA
Estimated Equity
$81,621
Purchase Details
Closed on
Aug 12, 2016
Sold by
Clark Ryan Lex and Clark Jennifer Lynn
Bought by
Clanahan Holten N
Home Financials for this Owner
Home Financials are based on the most recent Mortgage that was taken out on this home.
Original Mortgage
$103,588
Interest Rate
3.48%
Mortgage Type
FHA
Purchase Details
Closed on
Sep 5, 2001
Sold by
Lynn Winford and Lynn Sharon
Bought by
Clark Ryan Lex and Clark Jennifer L
Purchase Details
Closed on
Aug 10, 1994
Sold by
Hensley Bobbie
Create a Home Valuation Report for This Property
The Home Valuation Report is an in-depth analysis detailing your home's value as well as a comparison with similar homes in the area
Home Values in the Area
Average Home Value in this Area
Purchase History
| Date | Buyer | Sale Price | Title Company |
|---|---|---|---|
| Shaw Brian C | $110,500 | Stephens Co Abstract Co | |
| Shaw Brian C | $110,500 | Stephens Co Abstract Co | |
| Clanahan Holten N | $105,500 | None Available | |
| Clanahan Holten N | $105,500 | None Available | |
| Clark Ryan Lex | $56,000 | -- | |
| Clark Ryan Lex | $56,000 | -- | |
| -- | $24,000 | -- | |
| -- | $12,000 | -- | |
| -- | $24,000 | -- | |
| -- | $12,000 | -- |
Source: Public Records
Mortgage History
| Date | Status | Borrower | Loan Amount |
|---|---|---|---|
| Open | Shaw Brian C | $108,498 | |
| Previous Owner | Clanahan Holten N | $103,588 |
Source: Public Records
Tax History Compared to Growth
Tax History
| Year | Tax Paid | Tax Assessment Tax Assessment Total Assessment is a certain percentage of the fair market value that is determined by local assessors to be the total taxable value of land and additions on the property. | Land | Improvement |
|---|---|---|---|---|
| 2025 | $1,071 | $11,840 | $451 | $11,389 |
| 2024 | $1,071 | $11,824 | $451 | $11,373 |
| 2023 | $1,020 | $11,261 | $451 | $10,810 |
| 2022 | $1,048 | $11,577 | $451 | $11,126 |
| 2021 | $1,125 | $12,184 | $348 | $11,836 |
| 2020 | $1,018 | $12,107 | $348 | $11,759 |
| 2019 | $1,034 | $11,754 | $348 | $11,406 |
| 2018 | $1,032 | $11,788 | $348 | $11,440 |
| 2017 | $892 | $11,659 | $348 | $11,311 |
| 2016 | $701 | $9,343 | $660 | $8,683 |
| 2015 | $514 | $9,071 | $660 | $8,411 |
| 2014 | $514 | $8,807 | $660 | $8,147 |
Source: Public Records
Map
Nearby Homes
- 177074 Stephens Dr
- 177025 N 2810 Rd
- ???? S 2nd St
- 3889 Kensworth Dr
- 4001 4001 Collinsworth Dr
- 0 S 2nd St
- 176883 176883 N 2800 Rd
- 2710 2710 S 27th St
- 282096 Andrews Dr
- 281550 E 1800 Rd
- 5204 Kevin Dr
- 180163 Larue Dr
- 1407 1407 S King Place
- 1114 1114 S 10th St
- 0 W Stephens Ave
- 1109 W Stephens Ave
- 168466 9 Mile Rd
- 2299 Coretta Ave
- 711 711 S 12th
- 1007 S 8th St
- 177364 N 2820 Rd
- 177379 N 2820 Rd
- 6055 S 13th St
- 6005 S 13th St
- 177357 N 2820 Rd
- 177273 N 2820 Rd
- 5875 S 13th St
- 5825 S 13th St
- 177141 N 2820 Rd
- 5725 S 13th St
- 177095 N 2820 Rd
- 5715 5715 S 13th
- 5655 S 13th St
- 1 W Fuller Rd
- 6 W Fuller Rd
- 5 W Fuller Rd
- 2 W Fuller Rd
- 1490 W Fuller Rd
- 514 Rr 5
- 6695 S 13th St