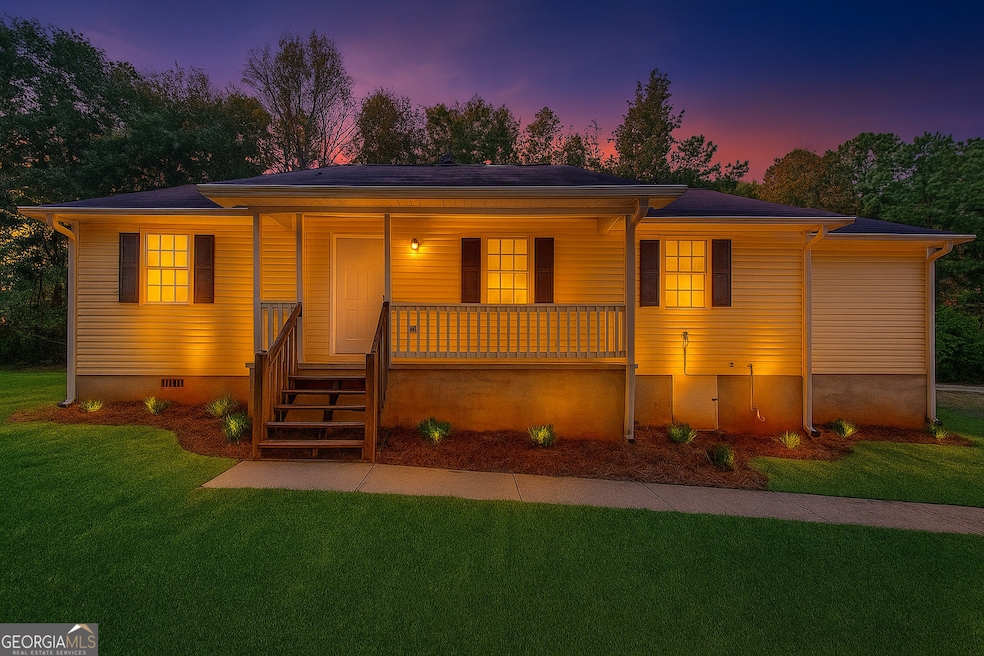


1774 Stroud Rd McDonough, GA 30252
Estimated payment $1,650/month
Highlights
- RV or Boat Parking
- 1.58 Acre Lot
- Private Lot
- Ola High School Rated A-
- Deck
- Vaulted Ceiling
About This Home
Seller offering Refrigerator, Washer/Dryer package and 1 year home warranty with acceptable offer! Welcome home to the peace and privacy you have been searching for. This move-in ready home on approximately 1.5 private acres in the highly sought-after Ola School District offers the perfect blend of quiet country living and everyday convenience, with no HOA and plenty of room to breathe. From the moment you arrive, the property feels like a retreat. The long driveway, open space, and private setting make it clear that this is not your typical crowded subdivision home. Inside, you will find fresh, modern updates throughout. The home features new interior paint, new flooring with a lifetime warranty, updated lighting, modern fixtures, and refreshed bathrooms, all designed for comfort and low-maintenance living. The family room with a cozy fireplace creates an inviting space for relaxing nights at home. The updated kitchen includes new countertops, new appliances, and a bright dining and breakfast area overlooking the peaceful backyard. It is an ideal spot for morning coffee, family meals, or weekend gatherings. The split bedroom floor plan gives the owner's suite added privacy, complete with an updated bathroom with tile floors and modern fixtures. The secondary bedrooms are generously sized, and the second bathroom has also been fully refreshed. There are no renovation projects waiting on you here. Simply move in and enjoy. Outside is where this property truly shines. The large covered front porch is perfect for rocking chairs and quiet mornings, while the expansive backyard offers space for kids, pets, gardening, or future outdoor projects. An outdoor storage building provides extra space for tools, hobbies, and equipment, and the attached garage adds everyday convenience. Additional updates include improved plumbing and electrical systems, giving buyers peace of mind and low-maintenance living. Located just minutes from the new Publix, dining, shopping, and parks, this home offers the best of both worlds. You get private acreage in a top school district with easy access to everything you need. USDA eligible, making it a great opportunity for affordable homeownership. If you are searching for a home with land, privacy, updates, and a peaceful lifestyle, this one checks every box.
Home Details
Home Type
- Single Family
Est. Annual Taxes
- $4,049
Year Built
- Built in 1996
Lot Details
- 1.58 Acre Lot
- Private Lot
Home Design
- Ranch Style House
- Composition Roof
- Vinyl Siding
Interior Spaces
- 1,176 Sq Ft Home
- Vaulted Ceiling
- Ceiling Fan
- Family Room with Fireplace
- Formal Dining Room
- Crawl Space
Kitchen
- Breakfast Area or Nook
- Oven or Range
- Dishwasher
- Stainless Steel Appliances
- Solid Surface Countertops
Flooring
- Laminate
- Tile
Bedrooms and Bathrooms
- 3 Main Level Bedrooms
- Split Bedroom Floorplan
- Walk-In Closet
- 2 Full Bathrooms
- Separate Shower
Laundry
- Laundry Room
- Laundry in Kitchen
Parking
- Garage
- Parking Accessed On Kitchen Level
- Side or Rear Entrance to Parking
- RV or Boat Parking
Outdoor Features
- Deck
- Patio
- Outbuilding
Schools
- Rock Spring Elementary School
- Ola Middle School
- Ola High School
Utilities
- Central Air
- Heating System Uses Propane
- Propane
- Septic Tank
- Phone Available
Community Details
- No Home Owners Association
Listing and Financial Details
- Tax Lot 182
Map
Home Values in the Area
Average Home Value in this Area
Tax History
| Year | Tax Paid | Tax Assessment Tax Assessment Total Assessment is a certain percentage of the fair market value that is determined by local assessors to be the total taxable value of land and additions on the property. | Land | Improvement |
|---|---|---|---|---|
| 2025 | $3,898 | $97,600 | $15,680 | $81,920 |
| 2024 | $3,898 | $97,040 | $14,200 | $82,840 |
| 2023 | $3,739 | $96,440 | $13,680 | $82,760 |
| 2022 | $2,925 | $75,200 | $12,600 | $62,600 |
| 2021 | $2,263 | $57,960 | $10,840 | $47,120 |
| 2020 | $2,094 | $53,560 | $10,200 | $43,360 |
| 2019 | $1,938 | $49,480 | $9,680 | $39,800 |
| 2018 | $1,728 | $44,000 | $8,712 | $35,288 |
| 2016 | $1,090 | $34,440 | $6,960 | $27,480 |
| 2015 | $1,025 | $32,200 | $7,040 | $25,160 |
| 2014 | $962 | $30,400 | $7,040 | $23,360 |
Property History
| Date | Event | Price | List to Sale | Price per Sq Ft |
|---|---|---|---|---|
| 12/02/2025 12/02/25 | For Sale | $249,900 | -- | $213 / Sq Ft |
Purchase History
| Date | Type | Sale Price | Title Company |
|---|---|---|---|
| Warranty Deed | -- | -- | |
| Warranty Deed | $110,000 | -- | |
| Warranty Deed | -- | -- | |
| Deed | $76,400 | -- |
Mortgage History
| Date | Status | Loan Amount | Loan Type |
|---|---|---|---|
| Open | $88,000 | New Conventional | |
| Closed | $88,000 | New Conventional | |
| Previous Owner | $41,180 | New Conventional | |
| Closed | $0 | No Value Available |
Source: Georgia MLS
MLS Number: 10651648
APN: 0177-01-014-001
Disclaimer: Certain information contained herein is derived from information provided by parties other than Homes.com. All information provided is deemed reliable, but is not guaranteed to be accurate and should be independently verified.
![]() The data relating to real estate for sale on this web site comes in part from the Broker Reciprocity Program of Georgia MLS. Real estate listings held by brokerage firms other than Redfin are marked with the Broker Reciprocity logo and detailed information about them includes the name of the listing brokers. Information deemed reliable but not guaranteed. Copyright 2025 Georgia MLS. All rights reserved.
The data relating to real estate for sale on this web site comes in part from the Broker Reciprocity Program of Georgia MLS. Real estate listings held by brokerage firms other than Redfin are marked with the Broker Reciprocity logo and detailed information about them includes the name of the listing brokers. Information deemed reliable but not guaranteed. Copyright 2025 Georgia MLS. All rights reserved.
- 1801 Stroud Rd
- 518 Gallantry Trail
- 423 Serenity Walk
- 1919 Stroud Rd
- 224 Calli Ct
- 227 Aves Ct
- 78 Maddox Dr
- 2082 Stroud Rd
- 133 Gambier Cove
- 0 Fincherville Rd Unit TRACT 2 10435272
- 0 Fincherville Rd Unit TRACT 3 10435292
- 440 Corral Pass
- 133 Potomac Dr
- 1120 Jackson Lake Rd
- 1190 Jackson Lake Rd
- 1120 Stroud Rd
- 320 Ponderosa Trail
- 106 Meadow View Dr
- 204 Clear Springs Ct
- 230 Hyannis Dr
- 51 Giles Dr
- 488 Old Tree Dr
- 155 Stroud Rd
- 565 Jackson Lake Rd
- 344 Mary Dr
- 256 Suffolk Way
- 144 Ducati Dr
- 335 Cattlemans Cir
- 641 Honey Creek Rd
- 609 Honey Creek Rd
- 520 Butler Bridge Dr
- 1055 Crown Landing Pkwy
- 75 Heyman Dr
- 306 Laney Rd
- 1325 Carney Ct
- 2236 Peeksville Rd
- 20 Sloane Ct
- 20 Sloane Ct
- 181 Charolais Dr
- 117 Starlake Dr
