17745 Williams County Road 8 Montpelier, OH 43543
Estimated Value: $167,000 - $259,000
4
Beds
1
Bath
1,940
Sq Ft
$112/Sq Ft
Est. Value
About This Home
This home is located at 17745 Williams County Road 8, Montpelier, OH 43543 and is currently estimated at $217,810, approximately $112 per square foot. 17745 Williams County Road 8 is a home located in Williams County with nearby schools including North Central Elementary School and North Central Junior/Senior High School.
Ownership History
Date
Name
Owned For
Owner Type
Purchase Details
Closed on
Aug 30, 2021
Sold by
Fraley Krista M
Bought by
Smith Francis Paul and Smith Glenda
Current Estimated Value
Purchase Details
Closed on
Jul 23, 2009
Sold by
Walz Pamela S
Bought by
Fraley Krista M
Home Financials for this Owner
Home Financials are based on the most recent Mortgage that was taken out on this home.
Original Mortgage
$17,000
Interest Rate
5.49%
Mortgage Type
Purchase Money Mortgage
Purchase Details
Closed on
Mar 10, 2004
Sold by
Dohm Dohm C C and Dohm Beth O
Bought by
Dohm Frederick W
Purchase Details
Closed on
Jun 20, 2003
Sold by
Dohm Fredrick W
Bought by
Dohm Dohm C and Dohm Beth O
Purchase Details
Closed on
Jun 11, 2003
Sold by
Dohm Fredrick W And
Bought by
Dohm Fredrick W
Purchase Details
Closed on
Sep 14, 1989
Bought by
Dohm Fredrick W And
Create a Home Valuation Report for This Property
The Home Valuation Report is an in-depth analysis detailing your home's value as well as a comparison with similar homes in the area
Home Values in the Area
Average Home Value in this Area
Purchase History
| Date | Buyer | Sale Price | Title Company |
|---|---|---|---|
| Smith Francis Paul | $155,000 | None Available | |
| Fraley Krista M | $22,000 | None Available | |
| Dohm Frederick W | -- | -- | |
| Dohm Dohm C | $85,000 | -- | |
| Dohm Fredrick W | -- | -- | |
| Dohm Fredrick W And | $40,000 | -- |
Source: Public Records
Mortgage History
| Date | Status | Borrower | Loan Amount |
|---|---|---|---|
| Closed | Fraley Krista M | $17,000 |
Source: Public Records
Tax History Compared to Growth
Tax History
| Year | Tax Paid | Tax Assessment Tax Assessment Total Assessment is a certain percentage of the fair market value that is determined by local assessors to be the total taxable value of land and additions on the property. | Land | Improvement |
|---|---|---|---|---|
| 2024 | $2,370 | $59,500 | $7,280 | $52,220 |
| 2023 | $2,370 | $27,900 | $7,350 | $20,550 |
| 2022 | $1,234 | $27,900 | $7,350 | $20,550 |
| 2021 | $1,234 | $27,900 | $7,350 | $20,550 |
| 2020 | $1,075 | $23,250 | $6,130 | $17,120 |
| 2019 | $1,067 | $23,250 | $6,130 | $17,120 |
| 2018 | $975 | $23,250 | $6,130 | $17,120 |
| 2017 | $932 | $20,870 | $5,920 | $14,950 |
| 2016 | $886 | $20,870 | $5,920 | $14,950 |
| 2015 | $930 | $20,870 | $5,920 | $14,950 |
| 2014 | $930 | $20,870 | $5,920 | $14,950 |
| 2013 | $923 | $20,870 | $5,920 | $14,950 |
Source: Public Records
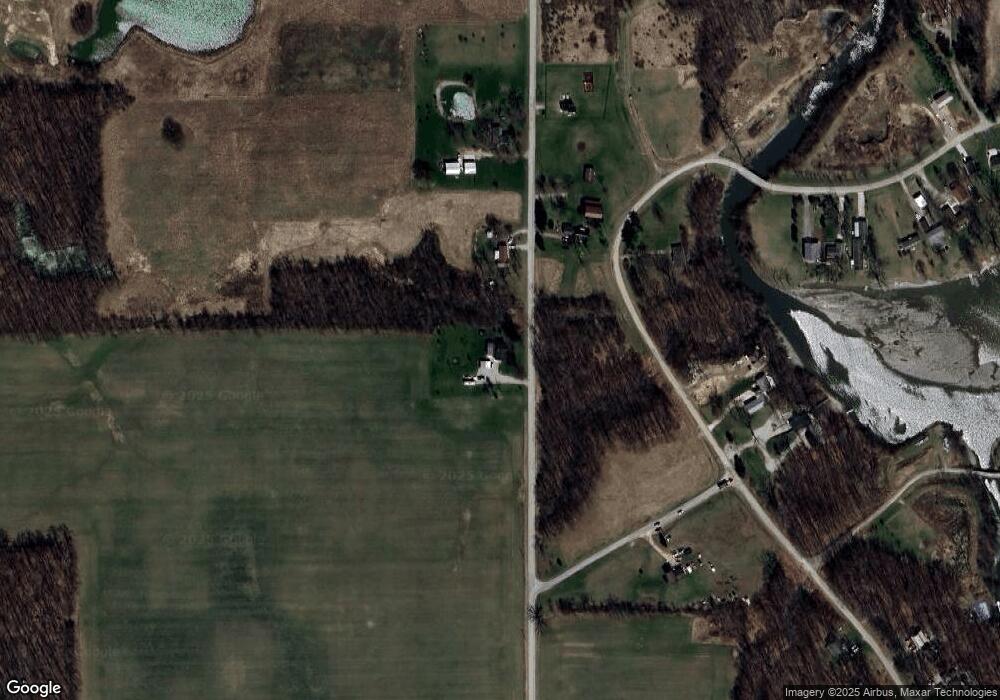
Map
Nearby Homes
- 623-624 Yuma Trail
- 600 Seneca Dr
- 988-989 Seneca Dr
- 638 Seneca Dr
- 207 Modoc Trail
- 213 Navajo Trail
- 234 Seneca Dr
- 0 Pontiac Trail Unit 10001711
- 155 Navajo Trail
- 145 Lumbee Ln
- 131 Choctaw Trail
- 14934 Heather Ct
- 14364 Horn Dr
- 0 W Territorial Rd Unit 25043960
- 0 W Territorial Rd Unit 11603977
- 7208 County Road N-30
- 7208 County Road N30
- 16993 County Road 12
- 13551 Hillsdale Rd
- 13844 County Road 6
- 17745 County Road 8
- 17803 County Road 8
- 417 Seneca Dr
- 454 Seneca Dr
- 000 Seneca (Lots 753-755)
- 17863 County Road 8
- 460 Seneca Dr
- 464 Seneca Dr
- 465 Seneca Lot 788 & 789 Dr
- 464 Seneca Lot 788 & 789 Dr
- 464 Seneca Lot 789
- 464 Seneca Lot 788
- 438 Tass Dr
- 446 Seneca Dr
- 444 Seneca Dr
- 0 Seneca Isle Lots 801 & 802
- 440 Seneca Dr
- 438 Seneca Dr
- 8602 8602 Co Rd R
- 0 Co Rd R