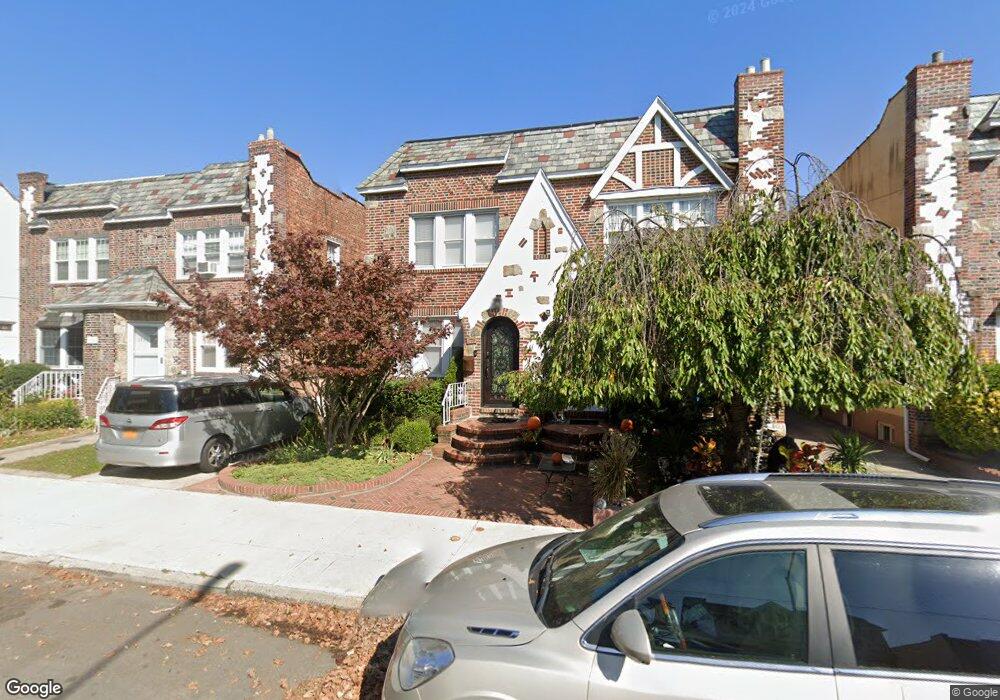
1775 E 34th St Brooklyn, NY 11234
Marine Park NeighborhoodEstimated Value: $881,475 - $1,001,000
Studio
--
Bath
1,580
Sq Ft
$599/Sq Ft
Est. Value
About This Home
This home is located at 1775 E 34th St, Brooklyn, NY 11234 and is currently estimated at $946,869, approximately $599 per square foot. 1775 E 34th St is a home located in Kings County with nearby schools including PS 222 Katherine R Snyder, J.H.S. 278 Marine Park, and James Madison High School.
Ownership History
Date
Name
Owned For
Owner Type
Purchase Details
Closed on
Oct 16, 2017
Sold by
Meyer Douglas B and Meyer Sonia J
Bought by
Jacob Elvina and Jacob Jason
Current Estimated Value
Home Financials for this Owner
Home Financials are based on the most recent Mortgage that was taken out on this home.
Original Mortgage
$575,000
Outstanding Balance
$481,442
Interest Rate
3.91%
Mortgage Type
Purchase Money Mortgage
Estimated Equity
$465,428
Create a Home Valuation Report for This Property
The Home Valuation Report is an in-depth analysis detailing your home's value as well as a comparison with similar homes in the area
Home Values in the Area
Average Home Value in this Area
Purchase History
| Date | Buyer | Sale Price | Title Company |
|---|---|---|---|
| Jacob Elvina | $822,000 | -- |
Source: Public Records
Mortgage History
| Date | Status | Borrower | Loan Amount |
|---|---|---|---|
| Open | Jacob Elvina | $575,000 |
Source: Public Records
Tax History
| Year | Tax Paid | Tax Assessment Tax Assessment Total Assessment is a certain percentage of the fair market value that is determined by local assessors to be the total taxable value of land and additions on the property. | Land | Improvement |
|---|---|---|---|---|
| 2025 | $8,310 | $54,300 | $11,400 | $42,900 |
| 2024 | $8,310 | $53,040 | $11,400 | $41,640 |
| 2023 | $7,928 | $58,920 | $11,400 | $47,520 |
| 2022 | $7,352 | $50,160 | $11,400 | $38,760 |
| 2021 | $7,750 | $49,800 | $11,400 | $38,400 |
| 2019 | $7,212 | $47,760 | $11,400 | $36,360 |
| 2018 | $6,631 | $32,529 | $8,296 | $24,233 |
| 2017 | $5,956 | $30,688 | $7,743 | $22,945 |
| 2016 | $5,825 | $30,688 | $9,197 | $21,491 |
| 2015 | $3,272 | $30,455 | $10,398 | $20,057 |
| 2014 | $3,272 | $28,732 | $10,399 | $18,333 |
Source: Public Records
Map
Nearby Homes
- 1743 E 33rd St
- 1821 E 34th St
- 1715 E 35th St
- 1736 E 33rd St
- 1840 E 35th St
- 1750 E 37th St
- 1719 E 36th St
- 1774 E 32nd St
- 1859 E 34th St
- 1664 E 35th St
- 3620 Quentin Rd
- 3112 Quentin Rd
- 1817 E 37th St
- 3411 Fillmore Ave
- 1861 E 32nd St
- 3617 Quentin Rd
- 1852 E 37th St
- 1752 E 38th St
- 1663 E 32nd St
- 1808 E 31st St
Your Personal Tour Guide
Ask me questions while you tour the home.