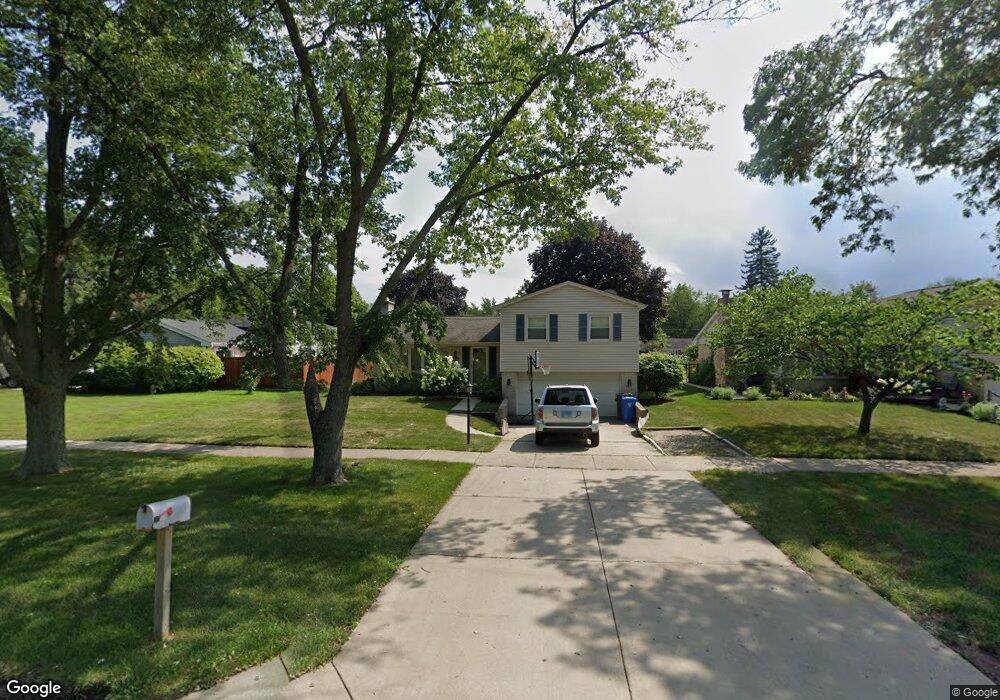
1775 E Camp Mcdonald Rd Mount Prospect, IL 60056
Forest River NeighborhoodEstimated Value: $447,000 - $514,000
4
Beds
3
Baths
1,475
Sq Ft
$327/Sq Ft
Est. Value
About This Home
This home is located at 1775 E Camp Mcdonald Rd, Mount Prospect, IL 60056 and is currently estimated at $482,949, approximately $327 per square foot. 1775 E Camp Mcdonald Rd is a home located in Cook County with nearby schools including Indian Grove Elementary School, River Trails Middle School, and John Hersey High School.
Ownership History
Date
Name
Owned For
Owner Type
Purchase Details
Closed on
Jun 9, 2006
Sold by
Boufford Christine M
Bought by
Jordan Kirk and Jordan Shannon
Current Estimated Value
Home Financials for this Owner
Home Financials are based on the most recent Mortgage that was taken out on this home.
Original Mortgage
$280,000
Outstanding Balance
$165,995
Interest Rate
6.72%
Mortgage Type
Unknown
Estimated Equity
$316,954
Purchase Details
Closed on
Oct 18, 2002
Sold by
Krejci Kevin and Bollin John
Bought by
Boufford Christine M
Home Financials for this Owner
Home Financials are based on the most recent Mortgage that was taken out on this home.
Original Mortgage
$224,000
Interest Rate
6.29%
Mortgage Type
Balloon
Purchase Details
Closed on
Aug 2, 2000
Sold by
Roginski Ronald and Roginski Delphine
Bought by
Krejci Kevin and Bollin John
Home Financials for this Owner
Home Financials are based on the most recent Mortgage that was taken out on this home.
Original Mortgage
$220,500
Interest Rate
8.24%
Create a Home Valuation Report for This Property
The Home Valuation Report is an in-depth analysis detailing your home's value as well as a comparison with similar homes in the area
Home Values in the Area
Average Home Value in this Area
Purchase History
| Date | Buyer | Sale Price | Title Company |
|---|---|---|---|
| Jordan Kirk | $353,000 | None Available | |
| Boufford Christine M | $280,000 | -- | |
| Krejci Kevin | $245,000 | -- |
Source: Public Records
Mortgage History
| Date | Status | Borrower | Loan Amount |
|---|---|---|---|
| Open | Jordan Kirk | $280,000 | |
| Previous Owner | Boufford Christine M | $224,000 | |
| Previous Owner | Krejci Kevin | $220,500 |
Source: Public Records
Tax History Compared to Growth
Tax History
| Year | Tax Paid | Tax Assessment Tax Assessment Total Assessment is a certain percentage of the fair market value that is determined by local assessors to be the total taxable value of land and additions on the property. | Land | Improvement |
|---|---|---|---|---|
| 2024 | $8,578 | $30,708 | $8,494 | $22,214 |
| 2023 | $8,200 | $31,889 | $8,494 | $23,395 |
| 2022 | $8,200 | $31,889 | $8,494 | $23,395 |
| 2021 | $8,123 | $27,809 | $5,426 | $22,383 |
| 2020 | $7,922 | $27,809 | $5,426 | $22,383 |
| 2019 | $7,952 | $31,003 | $5,426 | $25,577 |
| 2018 | $7,709 | $27,405 | $4,719 | $22,686 |
| 2017 | $8,177 | $29,027 | $4,719 | $24,308 |
| 2016 | $8,193 | $29,897 | $4,719 | $25,178 |
| 2015 | $7,403 | $25,384 | $4,011 | $21,373 |
| 2014 | $7,301 | $25,384 | $4,011 | $21,373 |
| 2013 | $7,107 | $25,384 | $4,011 | $21,373 |
Source: Public Records
Map
Nearby Homes
- 1512 N Oneida Ln
- 1813 E Wood Ln
- 1819 E Wood Ln
- 1811 E Maya Ln
- 1817 E Maya Ln
- 1822 E Tano Ln
- 1806 N Laurel Dr
- 1822 E Cree Ln
- 1597 Cove Dr Unit 185C
- 1314 N Lama Ln
- 2005 E Wintergreen Ave
- 838 E Old Willow Rd Unit 105
- 836 E Old Willow Rd Unit 212
- 16 E Old Willow Rd Unit 417S
- 16 E Old Willow Rd Unit 202S
- 16 E Old Willow Rd Unit 405S
- 818 E Old Willow Rd Unit 207
- 18 E Old Willow Rd Unit 210N
- 18 E Old Willow Rd Unit 106N
- 842 E Old Willow Rd Unit 107
- 1773 E Camp Mcdonald Rd
- 1430 N Columbine Dr
- 1771 E Camp Mcdonald Rd
- 1774 E Wood Ln
- 1772 E Wood Ln
- 1426 N Columbine Dr
- 1770 E Wood Ln
- 1769 E Camp Mcdonald Rd
- 1801 E Camp Mcdonald Rd
- 1770 E Camp Mcdonald Rd
- 1772 E Camp Mcdonald Rd
- 1768 E Wood Ln
- 1768 E Camp Mcdonald Rd
- 1767 E Camp Mcdonald Rd
- 1802 E Wood Ln
- 1766 E Wood Ln
- 1766 E Camp Mcdonald Rd
- 1765 E Camp Mcdonald Rd
- 1802 E Camp Mcdonald Rd
- 1502 N Larch Dr