Estimated Value: $1,242,615 - $2,261,000
2
Beds
3
Baths
1,204
Sq Ft
$1,371/Sq Ft
Est. Value
About This Home
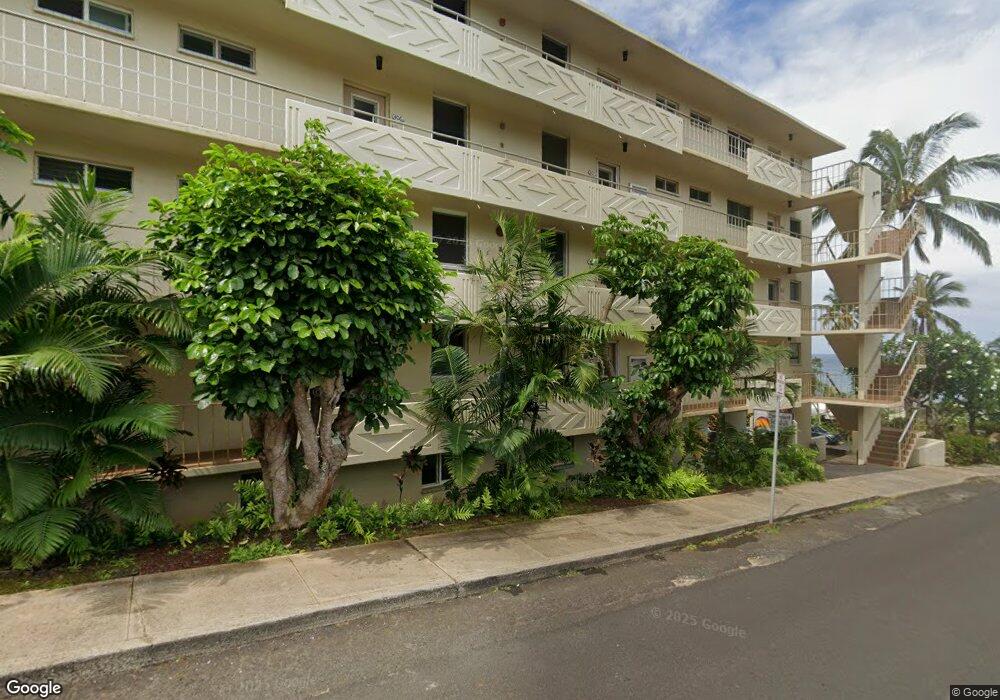
This home is located at 1775 Pee Rd Unit 104C, Koloa, HI 96756 and is currently estimated at $1,651,154, approximately $1,371 per square foot. 1775 Pee Rd Unit 104C is a home located in Kauai County with nearby schools including Koloa Elementary School, Chiefess Kamakahelei Middle School, and Kauai High School.
Ownership History
Date
Name
Owned For
Owner Type
Purchase Details
Closed on
Dec 19, 2012
Sold by
Freeman Gary and Freeman Carla
Bought by
Cdc Llc
Current Estimated Value
Purchase Details
Closed on
Aug 14, 2012
Sold by
Mann Chris A
Bought by
Freeman Gary and Freeman Carla
Home Financials for this Owner
Home Financials are based on the most recent Mortgage that was taken out on this home.
Original Mortgage
$542,500
Interest Rate
3.56%
Mortgage Type
New Conventional
Purchase Details
Closed on
May 7, 2007
Sold by
Mann Chris A and Mann Kriss Ann
Bought by
Mann Chris A
Home Financials for this Owner
Home Financials are based on the most recent Mortgage that was taken out on this home.
Original Mortgage
$965,000
Interest Rate
8%
Mortgage Type
New Conventional
Purchase Details
Closed on
Mar 23, 2006
Sold by
Leighty Kenneth E and Leighty Mary M
Bought by
Mann Chris A and Mann Kriss Ann
Home Financials for this Owner
Home Financials are based on the most recent Mortgage that was taken out on this home.
Original Mortgage
$798,000
Interest Rate
7.25%
Mortgage Type
New Conventional
Create a Home Valuation Report for This Property
The Home Valuation Report is an in-depth analysis detailing your home's value as well as a comparison with similar homes in the area
Home Values in the Area
Average Home Value in this Area
Purchase History
| Date | Buyer | Sale Price | Title Company |
|---|---|---|---|
| Cdc Llc | $1,000 | None Available | |
| Freeman Gary | $775,000 | Tg | |
| Mann Chris A | -- | Fhtc | |
| Mann Chris A | $1,140,000 | Fhtc |
Source: Public Records
Mortgage History
| Date | Status | Borrower | Loan Amount |
|---|---|---|---|
| Previous Owner | Freeman Gary | $542,500 | |
| Previous Owner | Mann Chris A | $965,000 | |
| Previous Owner | Mann Chris A | $798,000 |
Source: Public Records
Tax History Compared to Growth
Tax History
| Year | Tax Paid | Tax Assessment Tax Assessment Total Assessment is a certain percentage of the fair market value that is determined by local assessors to be the total taxable value of land and additions on the property. | Land | Improvement |
|---|---|---|---|---|
| 2025 | $19,224 | $1,568,200 | -- | $1,568,200 |
| 2024 | $19,224 | $1,674,400 | -- | $1,674,400 |
| 2023 | $13,775 | $1,398,500 | $0 | $1,398,500 |
| 2022 | $10,785 | $1,094,900 | $0 | $0 |
| 2021 | $10,207 | $1,036,200 | $0 | $0 |
| 2020 | $10,129 | $1,028,300 | $0 | $1,028,300 |
| 2019 | $9,360 | $950,300 | $0 | $950,300 |
| 2018 | $8,787 | $892,100 | $0 | $892,100 |
| 2017 | $7,647 | $864,100 | $0 | $864,100 |
| 2016 | $7,320 | $827,100 | $0 | $827,100 |
| 2015 | $3,804 | $859,600 | $0 | $0 |
| 2014 | $6,268 | $829,800 | $0 | $0 |
Source: Public Records
Map
Nearby Homes
- 1763 Pee Rd Unit 304
- 2261 Hoohu Rd
- 1711 Pee Rd
- 1871 Pee Rd Unit 1
- 1870 Hoone Rd Unit 831
- 1870 Hoone Rd Unit 511
- 1870 Hoone Rd Unit 600
- 1870 Hoone Rd Unit 525
- 1661 Pee Rd Unit I302
- 2239 Maka Place
- 1645 Pe'E Rd
- 1629 Makanui Rd
- 2371 Hoohu Rd Unit 703
- 2371 Hoohu Rd Unit 610
- 1568 Pee Rd Unit 211
- 1901 Poipu Rd Unit 112
- 1901 Poipu Rd Unit 924
- 1901 Poipu Rd Unit 612
- 1901 Poipu Rd Unit 311
- 1901 Poipu Rd Unit 411
- 1775 Pee Rd Unit 405A
- 1775 Pee Rd Unit 105C
- 1775 Pee Rd Unit 103C
- 1775 Pee Rd Unit 102C
- 1775 Pee Rd Unit 101C
- 1775 Pee Rd Unit 302B
- 1775 Pee Rd Unit 301B
- 1775 Pee Rd Unit 203B
- 1775 Pee Rd Unit 202B
- 1775 Pee Rd Unit 201B
- 1775 Pee Rd Unit 102B
- 1775 Pee Rd Unit 101B
- 1775 Pee Rd Unit 406A
- 1775 Pee Rd Unit 404A
- 1775 Pee Rd Unit 403A
- 1775 Pee Rd Unit 402A
- 1775 Pee Rd Unit 401A
- 1775 Pee Rd Unit 307A
- 1775 Pee Rd Unit 306A
- 1775 Pee Rd Unit 305A