3
Beds
--
Bath
975
Sq Ft
3.74
Acres
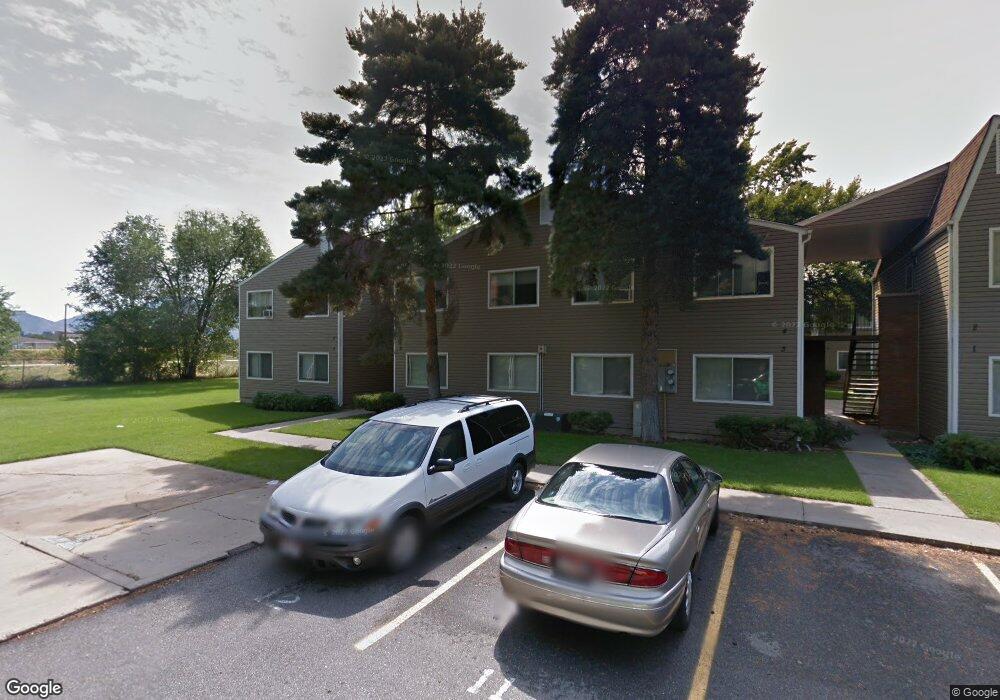
About This Home
This home is located at 1775 W 4800 S, Roy, UT 84067. 1775 W 4800 S is a home located in Weber County with nearby schools including Lakeview Elementary School, Roy Junior High School, and Roy High School.
Ownership History
Date
Name
Owned For
Owner Type
Purchase Details
Closed on
Aug 13, 2025
Sold by
Nwi Dawn Llc
Bought by
Ipg Ivy Partners Llc
Home Financials for this Owner
Home Financials are based on the most recent Mortgage that was taken out on this home.
Original Mortgage
$6,265,000
Outstanding Balance
$6,176,855
Interest Rate
6.72%
Mortgage Type
New Conventional
Purchase Details
Closed on
Dec 9, 2021
Sold by
Djm 19 Llc
Bought by
Nwi Dawn Llc
Home Financials for this Owner
Home Financials are based on the most recent Mortgage that was taken out on this home.
Original Mortgage
$9,000,000
Interest Rate
3.14%
Mortgage Type
New Conventional
Purchase Details
Closed on
Oct 11, 2011
Sold by
R F Rawson Co Inc
Bought by
Djm 19 Llc
Home Financials for this Owner
Home Financials are based on the most recent Mortgage that was taken out on this home.
Original Mortgage
$1,904,000
Interest Rate
4.01%
Mortgage Type
Commercial
Purchase Details
Closed on
Sep 28, 2011
Sold by
Ladawn Apartments Ii
Bought by
R F Rawson Co Inc
Home Financials for this Owner
Home Financials are based on the most recent Mortgage that was taken out on this home.
Original Mortgage
$1,904,000
Interest Rate
4.01%
Mortgage Type
Commercial
Purchase Details
Closed on
Sep 27, 2011
Sold by
Ladawn Apartments Ii
Bought by
Ladawn Apartments Ii
Home Financials for this Owner
Home Financials are based on the most recent Mortgage that was taken out on this home.
Original Mortgage
$1,904,000
Interest Rate
4.01%
Mortgage Type
Commercial
Create a Home Valuation Report for This Property
The Home Valuation Report is an in-depth analysis detailing your home's value as well as a comparison with similar homes in the area
Home Values in the Area
Average Home Value in this Area
Purchase History
| Date | Buyer | Sale Price | Title Company |
|---|---|---|---|
| Ipg Ivy Partners Llc | -- | Cottonwood Title | |
| Nwi Dawn Llc | -- | Cottonwood Title | |
| Djm 19 Llc | -- | American Preferred Title | |
| R F Rawson Co Inc | -- | American Preferred Title | |
| Ladawn Apartments Ii | -- | American Preferred Title | |
| Ladawn Apartments I | -- | American Preferred Title | |
| Ladawn Apartments Ii | -- | American Preferred Title |
Source: Public Records
Mortgage History
| Date | Status | Borrower | Loan Amount |
|---|---|---|---|
| Open | Ipg Ivy Partners Llc | $6,265,000 | |
| Previous Owner | Nwi Dawn Llc | $9,000,000 | |
| Previous Owner | Djm 19 Llc | $1,904,000 |
Source: Public Records
Property History
| Date | Event | Price | List to Sale | Price per Sq Ft |
|---|---|---|---|---|
| 10/04/2025 10/04/25 | Off Market | $899 | -- | -- |
| 03/15/2025 03/15/25 | Price Changed | $899 | 0.0% | $1 / Sq Ft |
| 03/12/2025 03/12/25 | Price Changed | $899 | 0.0% | $1 / Sq Ft |
| 11/15/2024 11/15/24 | Price Changed | $899 | 0.0% | $1 / Sq Ft |
| 10/22/2024 10/22/24 | Price Changed | $899 | -17.1% | $1 / Sq Ft |
| 09/17/2024 09/17/24 | Price Changed | $1,085 | -8.4% | $1 / Sq Ft |
| 08/27/2024 08/27/24 | Price Changed | $1,185 | 0.0% | $1 / Sq Ft |
| 04/09/2024 04/09/24 | Price Changed | $1,185 | 0.0% | $1 / Sq Ft |
| 02/23/2024 02/23/24 | Price Changed | $1,185 | 0.0% | $1 / Sq Ft |
| 02/21/2024 02/21/24 | Price Changed | $1,185 | +3.0% | $1 / Sq Ft |
| 02/17/2024 02/17/24 | Price Changed | $1,150 | -3.0% | $1 / Sq Ft |
| 01/03/2024 01/03/24 | Price Changed | $1,185 | +4.0% | $1 / Sq Ft |
| 12/12/2023 12/12/23 | Price Changed | $1,139 | +9.1% | $1 / Sq Ft |
| 12/06/2023 12/06/23 | Price Changed | $1,044 | -5.0% | $1 / Sq Ft |
| 11/21/2023 11/21/23 | Price Changed | $1,099 | 0.0% | $1 / Sq Ft |
| 10/12/2023 10/12/23 | Price Changed | $1,099 | +4.7% | $1 / Sq Ft |
| 10/05/2023 10/05/23 | Price Changed | $1,050 | -3.6% | $1 / Sq Ft |
| 09/14/2023 09/14/23 | Price Changed | $1,089 | -0.9% | $1 / Sq Ft |
| 08/29/2023 08/29/23 | Price Changed | $1,099 | 0.0% | $1 / Sq Ft |
| 08/25/2023 08/25/23 | Price Changed | $1,099 | 0.0% | $1 / Sq Ft |
| 08/14/2023 08/14/23 | Price Changed | $1,099 | 0.0% | $1 / Sq Ft |
| 08/09/2023 08/09/23 | Price Changed | $1,099 | 0.0% | $1 / Sq Ft |
| 08/07/2023 08/07/23 | For Rent | $1,099 | 0.0% | -- |
| 07/26/2023 07/26/23 | Price Changed | $1,099 | 0.0% | $1 / Sq Ft |
| 07/12/2023 07/12/23 | Price Changed | $1,099 | 0.0% | $1 / Sq Ft |
| 06/26/2023 06/26/23 | For Rent | $1,099 | 0.0% | -- |
| 06/14/2023 06/14/23 | For Rent | $1,099 | 0.0% | -- |
| 04/25/2023 04/25/23 | Price Changed | $1,099 | +4.7% | $1 / Sq Ft |
| 04/20/2023 04/20/23 | Price Changed | $1,050 | -4.5% | $1 / Sq Ft |
| 03/22/2023 03/22/23 | Price Changed | $1,099 | 0.0% | $1 / Sq Ft |
| 03/01/2023 03/01/23 | Price Changed | $1,099 | 0.0% | $1 / Sq Ft |
| 02/01/2023 02/01/23 | Price Changed | $1,099 | +4.7% | $1 / Sq Ft |
| 01/27/2023 01/27/23 | Price Changed | $1,050 | -4.5% | $1 / Sq Ft |
| 12/05/2022 12/05/22 | Price Changed | $1,099 | 0.0% | $1 / Sq Ft |
| 11/03/2022 11/03/22 | Price Changed | $1,099 | 0.0% | $1 / Sq Ft |
| 10/12/2022 10/12/22 | Price Changed | $1,099 | +4.7% | $1 / Sq Ft |
| 10/03/2022 10/03/22 | Price Changed | $1,050 | 0.0% | $1 / Sq Ft |
| 09/30/2022 09/30/22 | For Rent | $1,050 | -11.8% | -- |
| 09/20/2022 09/20/22 | Price Changed | $1,190 | +13.3% | $1 / Sq Ft |
| 09/01/2022 09/01/22 | Price Changed | $1,050 | -18.6% | $1 / Sq Ft |
| 08/23/2022 08/23/22 | Price Changed | $1,290 | -- | $1 / Sq Ft |
Tax History Compared to Growth
Tax History
| Year | Tax Paid | Tax Assessment Tax Assessment Total Assessment is a certain percentage of the fair market value that is determined by local assessors to be the total taxable value of land and additions on the property. | Land | Improvement |
|---|---|---|---|---|
| 2025 | $61,984 | $10,756,000 | $2,240,000 | $8,516,000 |
| 2024 | $60,182 | $10,544,997 | $2,240,000 | $8,304,997 |
| 2023 | $63,180 | $11,100,002 | $2,048,000 | $9,052,002 |
| 2022 | $36,970 | $6,560,000 | $1,280,000 | $5,280,000 |
| 2021 | $29,018 | $4,679,001 | $1,280,000 | $3,399,001 |
| 2020 | $22,730 | $3,341,996 | $691,898 | $2,650,098 |
| 2019 | $21,752 | $3,024,002 | $542,299 | $2,481,703 |
| 2018 | $21,838 | $2,879,823 | $542,299 | $2,337,524 |
| 2017 | $22,503 | $2,805,023 | $467,499 | $2,337,524 |
| 2016 | $13,780 | $916,668 | $82,280 | $834,388 |
| 2015 | $13,341 | $916,668 | $82,280 | $834,388 |
| 2014 | $13,458 | $532,034 | $82,280 | $449,754 |
Source: Public Records
Map
Nearby Homes
- 1789 W 5000 S
- 5006 S 1800 W
- 1765 W 5000 S
- 1758 W 5025 S
- 1789 W 5050 S
- 1777 W 5050 S
- 4602 Hathaway Dr
- 4593 Promenade Dr
- 2067 W 4750 S
- 1766 W 4575 S
- 4642 S 1900 W Unit 41
- 4848 S 2125 W
- 2107 W 4750 S
- 4552 S 1675 W
- 1825 W 4500 S Unit 101
- 4536 S 1900 W Unit 12
- 4501 S 1720 W
- 2038 W 4600 S
- 4502 S 1720 W
- 5140 S 2100 W
- 4824 S 1800 W Unit 8
- 4824 S 1800 W Unit 6
- 4824 S 1800 W Unit 5
- 4824 S 1800 W
- 1779 W 4800 S
- 1777 W 4800 S
- 4812 S 1800 W Unit 4
- 4812 S 1800 W Unit 3
- 4812 S 1800 W Unit 2
- 4812 S 1800 W Unit 1
- 4812 S 1800 W
- 4836 S 1800 W Unit 12
- 4836 S 1800 W Unit 11
- 4836 S 1800 W Unit 10
- 4836 S 1800 W Unit 9
- 4836 S 1800 W
- 1801 W 4800 S
- 1741 W 4800 S
- 1825 W 4800 S
- 4848 S 1800 W Unit 18